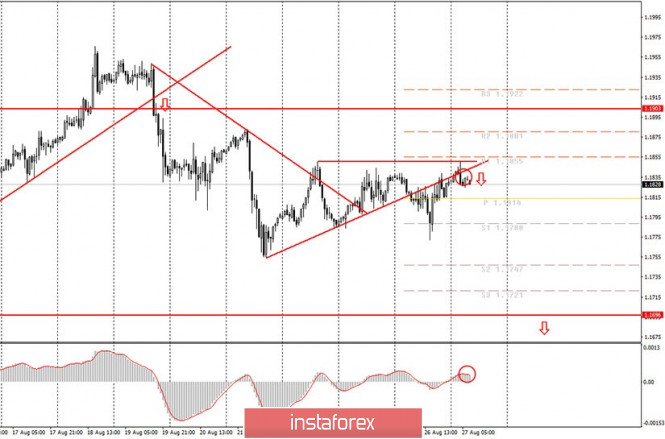
Hourly chart of the EUR/USD pair

The EUR/USD pair continued to move up along the upward trend line on Thursday night trading. Just from the bottom of this line. Let us remind novice traders that this line was crossed yesterday, so the trend changed to a downward one. We mentioned in the evening review that the main thing is that the price does not pass the previous two highs (1.1844 and 1.1850). It passed the first one last night, but not the second. Moreover, it rebounded off the 1.1850 level, and for a better visualization of what is happening, we built a horizontal line passing through both peaks. Thus, formally, the downward trend is not broken and it could resume moving down from the current price values. Moreover, the MACD indicator has already turned down, that is, it has generated a sell signal. At the same time, we understand that the pair is not trading very well at this time and is not very convenient to reach. The movement of the last few days falls more under the definition of a flat than a trend. Therefore, we advise novice traders to not forget about placing a Stop Loss order above that same horizontal line.
The calendar of macroeconomic events for the European Union is empty again on August 27. Meanwhile, the Economic Symposium will take place in the United States, which many traders have been waiting for from the very beginning of the week. By and large, today we are only interested in the speech of Federal Reserve Chairman Jerome Powell, which is scheduled for 14:00 London time (but may start a little earlier or later). Therefore you can trade without looking back at this event until almost the very evening. The US will also publish annual data on GDP, claims for unemployment benefits and indices of personal consumption expenditures on this day. The last two reports are unlikely to be reflected on the chart, the GDP report was already published about a month ago and this is just the second edition. That is, we will see the same -33% in the second quarter, which was announced a month earlier. Accordingly, most likely, all macroeconomic reports for today will not cause a reaction from traders. Going back to Powell's speech, he can give a regular talk, since this is just an economic forum where many academics and central bankers will share their views on monetary policy. This is not an event where Powell will report on monetary policy or have to make any decisions. Thus, it is possible that Powell will not report anything interesting today. However, we do not recommend that novice traders skip this event.
Possible scenarios for August 27:
1) It is not recommended to consider buying the pair at this time, since the price has settled below the upward trend line. For long deals, the pair can use the horizontal line that passes through the 1.1850 level. If the quotes gain a foothold above it, it will be possible to buy the euro with targets at 1.1881 and 1.1903. At the same time, we remind you that all the movements of the last few days are very much reminiscent of a flat, in which it is not recommended to trade, especially for beginners.
2) But we recommend opening sales at this time, since the price rebounded off the 1.1850 level. Thus, the targets for selling are set around the 1.1788 level or slightly lower. Given the current volatility of the EUR/USD pair, we do not expect a one-way movement of more than 50 points. It is recommended to set the Stop Loss level above the 1.1850 in order to protect yourself from a possible change in the pair's direction.
On the chart:
Support and Resistance Levels are the Levels that serve as targets when buying or selling the pair. You can place Take Profit near these levels.
Red lines are the channels or trend lines that display the current trend and show in which direction it is better to trade now.
Up/down arrows show where you should sell or buy after reaching or breaking through particular levels.
The MACD indicator consists of a histogram and a signal line. When they cross, this is a signal to enter the market. It is recommended to use this indicator in combination with trend lines (channels and trend lines).
Important announcements and economic reports that you can always find in the news calendar can seriously influence the trajectory of a currency pair. Therefore, at the time of their release, we recommended trading as carefully as possible or exit the market in order to avoid a sharp price reversal.
Beginners on Forex should remember that not every single trade has to be profitable. The development of a clear strategy and money management are the key to success in trading over a long period of time.
The material has been provided by InstaForex Company - www.instaforex.com


 Download NOW!
No comments:
Post a Comment