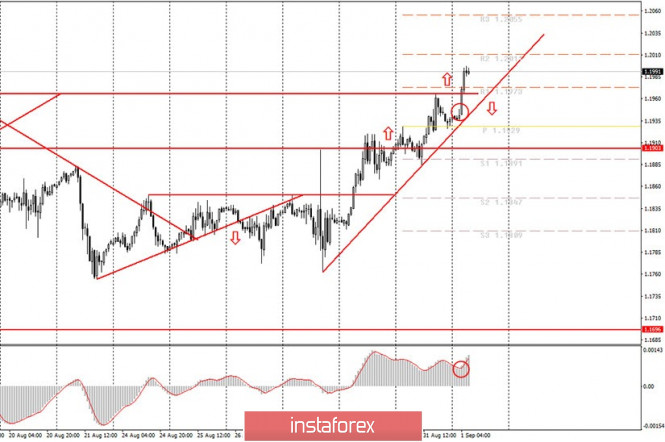
Hourly chart of the EUR/USD pair

The EUR/USD pair resumed moving up without any problems during Monday night trading and also rose by another 60 points. The 1.1967 level, which we pointed out yesterday as a possible strong resistance, turned out to be very weak in practice. The price settled above it, and at the same time, also above the first resistance level of 1.1973. The new upward movement began at about 4 am. That is, at a time when most traders were sleeping. Therefore, it was not possible to enter the market on time. Moreover, the MACD indicator failed to approach the zero mark again, and the upward movement began so sharply that the signal formed when the pair had already gone up by around 30 points. In general, we continue to insist that a rather complicated technical picture has developed for the EUR/USD pair. Especially for novice traders. On the one hand, there is a trend and it is strong enough and even a new upward trend line has been built, which supports movement to the upside. On the other hand, a strong trend must be worked out continuously, that is, without closing trades at each correction. A strong trend is not for intraday work. So it turns out that trading should be more aggressive now, which can result in losses for novice traders.
The EU macroeconomic calendar of events for September 1 contains the index of business activity in the manufacturing sector of the EU and Germany (as well as a number of other European countries), the unemployment rate in Germany, the consumer price index and unemployment rate in the European Union. Meanwhile, the Markit and ISM manufacturing business activity indices will be published today in America. From all this package of macroeconomic statistics, we can highlight inflation in the EU, as well as the ISM business activity index in the US. Unfortunately, the mood of market participants is now strictly directed at selling the dollar. Therefore, even if the data are in favor of the US currency, this does not mean that the dollar will increase today. However, novice traders should not miss today's reports, as in any case, macroeconomic data is needed in order to clearly understand the current state of the EU and/or US economy and how fast it is recovering from the crisis. Also scheduled for today is a speech by European Central Bank Vice President Luis de Guindos, who from time to time also shares very useful information with the markets.
Possible scenarios for September 1:
1) Buying the pair at this time is generally relevant. There is an upward trend line, the price is regularly moving up. But, as we have already mentioned, the current movement is very inconvenient for beginners who are not yet familiar with all the intricacies of the market. Thus, long deals on the euro are certainly possible with the targets of 1.2011 and 1.2055, but traders should clearly understand all the risks that they take on when opening such transactions. Quotes of the euro currency are still currently at two-year highs. And the US dollar is too oversold.
2) We also do not recommend considering sales right now, because there are no patterns that support the downward movement. If the price settles below the upward trend line, this can be used to open new sales of the pair with the target at 1.1891. However, the markets are now clearly set for selling the dollar, so it is not a fact that this consolidation will happen today. In any case, we recommend that novice traders behave with extreme caution in the coming days.
On the chart:
Support and Resistance Levels are the Levels that serve as targets when buying or selling the pair. You can place Take Profit near these levels.
Red lines are the channels or trend lines that display the current trend and show in which direction it is better to trade now.
Up/down arrows show where you should sell or buy after reaching or breaking through particular levels.
The MACD indicator consists of a histogram and a signal line. When they cross, this is a signal to enter the market. It is recommended to use this indicator in combination with trend lines (channels and trend lines).
Important announcements and economic reports that you can always find in the news calendar can seriously influence the trajectory of a currency pair. Therefore, at the time of their release, we recommended trading as carefully as possible or exit the market in order to avoid a sharp price reversal.
Beginners on Forex should remember that not every single trade has to be profitable. The development of a clear strategy and money management are the key to success in trading over a long period of time.
The material has been provided by InstaForex Company - www.instaforex.com


 Download NOW!
No comments:
Post a Comment