GBP/USD 1H

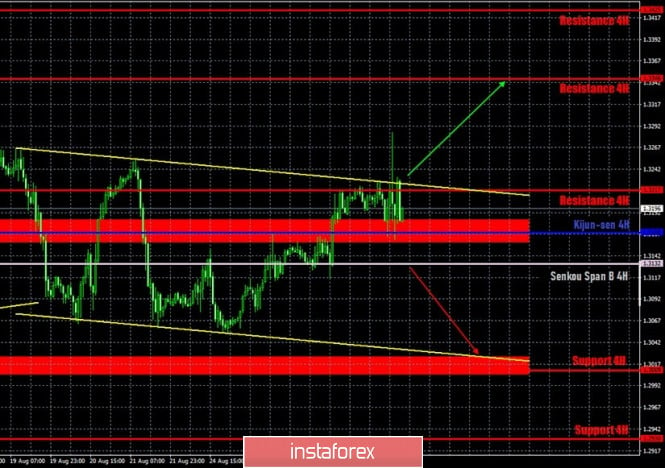
The GBP/USD pair showed the same movements as the EUR/USD pair during Federal Reserve Chairman Jerome Powell's hour of speech on August 27. Since quotes of the pound sterling were near the upper line of the descending channel, we expected either a rebound from it, or settling above it. However, as a result, the pair went above the channel by 60 points and at the same time failed to overcome it. In general, the markets panicked as much as they could. As a result, the technical picture has not changed in any way. Setting the pair above the downward channel will make it possible for the British currency to continue growing, which is absolutely unfounded, if we take into account the fundamental background from the UK. The final rebound from the upper line of the channel and the resistance level of 1.3217 will enable the US currency to rise again. In general, the pair continues to "swing". And you don't need to be an analyst to make such a conclusion. Looking at the graph, the essence of this concept becomes clear.
GBP/USD 15M

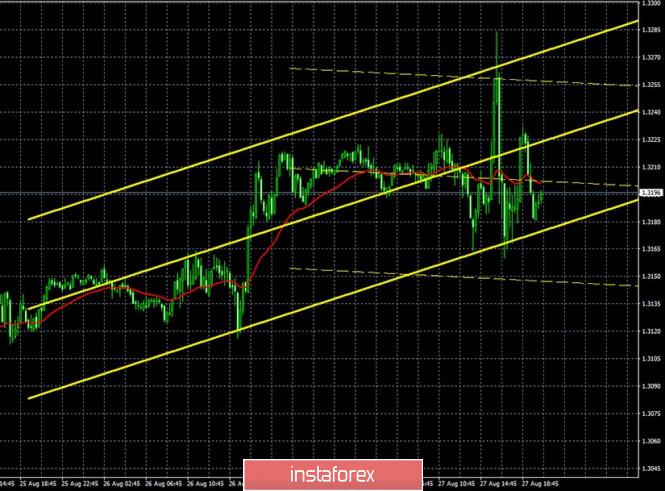
Both linear regression channels turned up on the 15-minute timeframe, therefore, an upward trend is now observed in the shortest term. The latest Commitments of Traders (COT) report for the British pound, which came out last Friday, was very predictable. Non-commercial traders reopened Buy-contracts (almost 6,000) and closed Sell-contracts (around 2,000) in the period from August 12 to 18. Thus, the net position for the "non-commercial" category of traders has grown again, by as much as 8,000 contracts. The pound sterling continued to rise against the US currency until August 18 inclusive, so the data from the COT report perfectly reflects what was happening in the market at that time. In the period from August 19 to 25, according to which the new COT report will be released on Friday, the British currency fell by around 150 points, which again does not give any good reason to expect that professional traders started to close Buy-contracts or open Sell-positions. Most likely, the new COT report will not show significant changes in the mood of large traders. And we will not be able to draw any conclusions about the end or maintaining the upward trend for the pound sterling. Nevertheless, the figures of the report can turn out to be unexpected and do not reflect the essence of what is happening in the foreign exchange market.
The fundamental background for the GBP/USD pair on Friday may be quite interesting for the pound. Bank of England Governor Andrew Bailey will deliver a speech at the same symposium in Jackson Hole. Of course, everything will depend on what exactly Bailey says, but keeping in mind what the movements were during Powell's speech, it is quite possible that we will see something similar today. The problem is that it is impossible to predict how the market will react to Bailey's speech. Yesterday, the pound/dollar pair rose 100 points in several hours and down the same amount. Therefore, there was no question of exactly how the market reacted to Powell's words. We believe that during Bailey's speech, you just need to be as careful as possible and clearly control all open trades at that time. No other British pound events are scheduled for Friday.
Based on the above, we have two trading ideas for August 28:
1) Buyers have become a little more active in recent days, but they failed to get the pair out of the downward channel. Thus, they need to overcome the upper line of the descending channel and the resistance level of 1.3217 for the British currency to continue to rise in price. In this case, we will recommend making new purchases with the target of 1.3346. Take Profit in this case will be about 100 points.
2) Bears can let go of the pair. If quotes go above the descending channel, then sales will cease to be relevant. Now, as a result, the price will remain below the 1.3217 level, this will allow you to sell the pair with the targets of the Senkou Span B line (1.3132) and the lower channel line. For greater confidence, you can wait for the price to settle below the Senkou Span B line. Take Profit in this case will be from 60 to 140 points.
Explanations for illustrations:
Support and Resistance Levels are the levels that serve as targets when buying or selling the pair. You can place Take Profit near these levels.
Kijun-sen and Senkou Span B lines are lines of the Ichimoku indicator transferred to the hourly timeframe from the 4-hour one.
Support and resistance areas are areas from which the price has repeatedly rebounded off.
Yellow lines are trend lines, trend channels and any other technical patterns.
The material has been provided by InstaForex Company - www.instaforex.com


 Download NOW!
No comments:
Post a Comment