To open long positions on EUR/USD, you need:
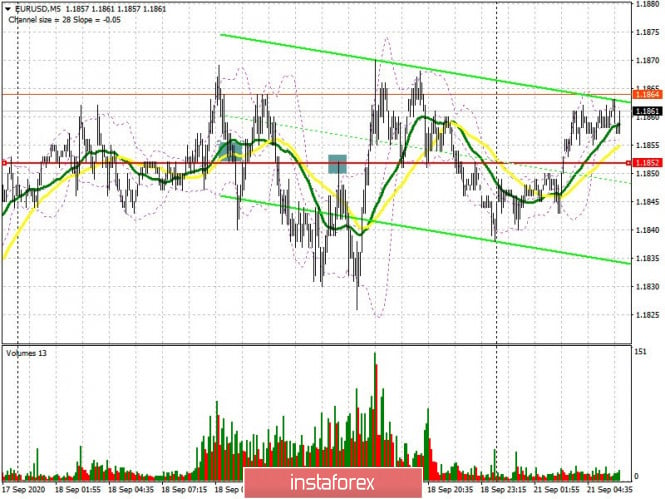
Considering that Friday was expected to be just like this - calm and with low volatility, we could not wait for acceptable signals to appear regarding market entry. Let's break down the trades and look at the 5-minute chart. A breakout and consolidating above the 1.1852 level in the morning and then testing it from top to bottom produced an entry point into long positions, but there was no growth. A similar entry point formed in the afternoon after testing the 1.1852 level from the bottom up. We managed to achieve a downward movement of about 20 points in that area, after which the market regained equilibrium and returned to the 1.1852 level. Before talking about the current prospects for the pair's movement, let's look at the situation in the futures market first since it has seriously changed, which may affect the alignment of forces in the future.
The Commitment of Traders (COT) reports for September 15 continued to record a reduction in long non-commercial positions and an increase in short ones, which confirms a downward correction in EUR/USD, which we recently observed. Thus, long non-commercial positions fell from 248,683 to 230,695, while short non-commercial positions rose from 51,869 to 52,199. The decisions that were made by the Federal Reserve last week, although they supported the US dollar, hardly changed the overall medium-term upward trend in the EUR/USD pair. Therefore, I recommend you to bet that the euro will strengthen this week. This is evidenced by the total non-commercial net position, which, although it slightly decreased over the reporting week, still remained at a positive level. As a result, the non-commercial net position fell to 178,576 against 196,814 a week earlier.
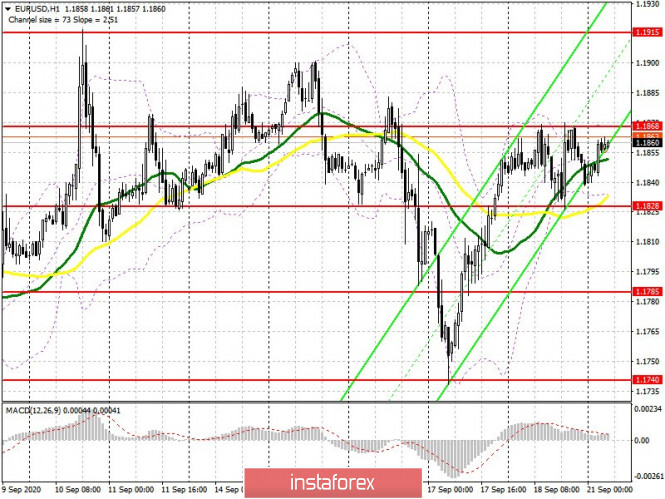
As for the current market situation, as I noted above, buyers need to quickly cope with the 1.1868 level and settle on it, which forms a good entry point into long positions. The main plan is for EUR/USD to return to the resistance level of 1.1915, which is also a rather important psychological mark. However, the 1.1964 area (this month's high) will still be the long term target, which is where I recommend taking profit. In case of a downward correction, and since we don't expect any important fundamental data today, trading may be purely go sideways/horizontally with low volatility, therefore, I recommend returning to long positions only when a false breakout appears in the support area of 1.1828, where the moving averages are concentrated, or you can buy the pair immediately on the rebound from the low of 1.1785, counting on the correction of 20-30 points within the day.

To open short positions on EUR/USD, you need:
Today we can expect regular speeches from the heads of the European Central Bank and the US Federal Reserve. However, its content is not yet clear. Most likely, they will be similar to those delivered last week. This could cause the euro to rise against the US dollar. Therefore, I recommend that you only open short positions when a false breakout forms at the 1.1868 level, in hopes of pulling down the pair to the intermediate support at 1.1828. Forming a breakout and consolidating below this range is an important goal for the bears, which will lead to a larger sell-off of EUR/USD to the low of 1.1785 and this can revive sellers' hope of testing the 1.1740 area, where I recommend taking profits. In case the euro grows above the 1.1868 level at the beginning of this week, and everything seems to be leading to this, it is best not to rush to sell, but wait for resistance to be updated at 1.1915 and then you can sell from there on a rebound, counting on a correction of 20-30 points within the day. The larger resistance level is concentrated in the 1.1964 area, where you can also sell the euro immediately on a rebound.

Indicator signals:
Moving averages
Trading is carried out in the area of 30 and 50 moving averages, which indicates the uncertainty of the market with its succeeding direction.
Note: The period and prices of moving averages are considered by the author on the H1 hourly chart and differs from the general definition of classic daily moving averages on the D1 daily chart.
Bollinger Bands
A break of the lower border of the indicator around 1.1830 will increase pressure on the euro. A breakout of the upper border of the indicator in the 1.1870 area will lead to a sharper rise in the euro.
Description of indicators
- Moving average (moving average, determines the current trend by smoothing out volatility and noise). Period 50. It is marked in yellow on the chart.
- Moving average (moving average, determines the current trend by smoothing out volatility and noise). Period 30. It is marked in green on the chart.
- MACD indicator (Moving Average Convergence/Divergence — convergence/divergence of moving averages) Quick EMA period 12. Slow EMA period to 26. SMA period 9
- Bollinger Bands (Bollinger Bands). Period 20
- Non-commercial speculative traders, such as individual traders, hedge funds, and large institutions that use the futures market for speculative purposes and meet certain requirements.
- Long non-commercial positions represent the total long open position of non-commercial traders.
- Short non-commercial positions represent the total short open position of non-commercial traders.
- Total non-commercial net position is the difference between short and long positions of non-commercial traders.


 Download NOW!
No comments:
Post a Comment