To open long positions on EUR/USD, you need:
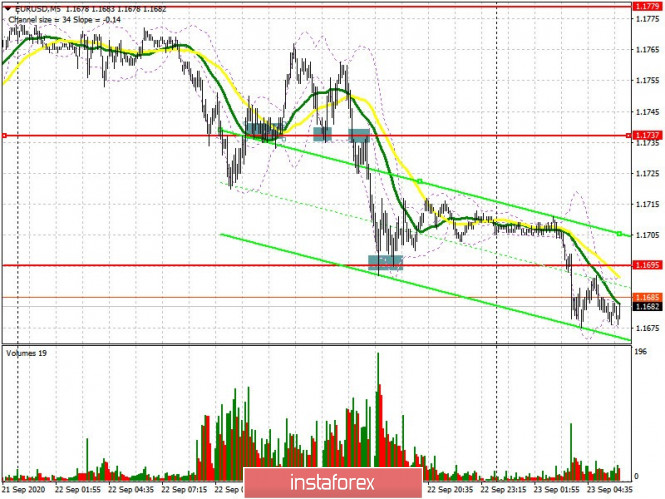
There were quite a lot of signals to enter the market yesterday, which I paid special attention to in my afternoon forecast. Let's get to it. If you look at the 5-minute chart, and recall my recommendation to buy the euro from the 1.1737 level, you will see how the bulls returned to this range and it caused the pair to rise by 30 points. But even those who failed to enter from this level were able to take advantage of it by repeatedly testing and falling to this range, afterwards a second, but less active wave of growth occurred, which was what euro buyers used to leave the market. The bears managed to subdue this range for themselves. As a result of testing the 1.1737 level, an excellent entry point into short positions appeared from the bottom up, which immediately caused the euro to fall to a low of 1.1695, where I recommended opening long positions immediately for a rebound, counting on a correction of 20-30 points, which happened...

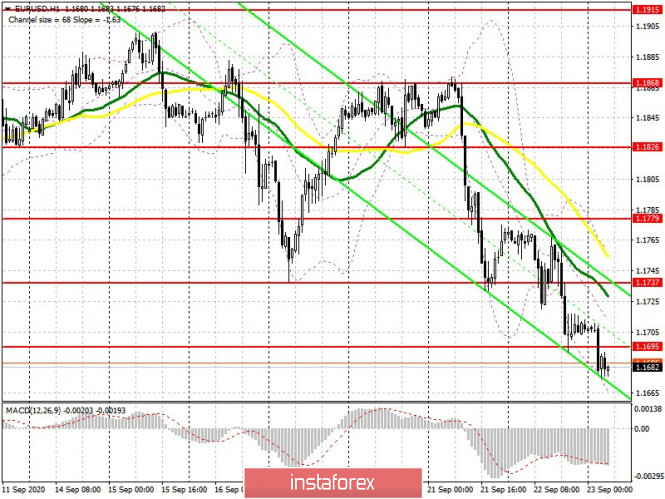
At the moment, the subsequent direction will depend on the PMI reports on the services and manufacturing sectors of the eurozone countries. Good data will help the bulls regain resistance at 1.1695, consolidation on which will be an excellent signal to open long positions in the hopes of pushing EUR/USD to the 1.1737 level, which is where I recommend taking profits. The 1.1779 area will be a distant target, but it will be possible to reach it in case we receive very bad US reports. If the eurozone data does not surprise you, then it is best to refuse to buy the euro and wait until support has been updated to 1.1648, afterwards a false breakout will be a signal to open long positions against the trend. I recommend buying EUR/USD immediately on a rebound but only from a low of 1.1585, counting on a correction of 20-30 points within the day.
Let me remind you that the Commitment of Traders (COT) reports for September 15 continued to record a reduction in long non-commercial positions and an increase in short ones, which confirms the downward correction in EUR/USD that we recently observed. Long non-commercial positions fell from 248,683 to 230,695, while short non-commercial positions rose from 51,869 to 52,199. The decisions that the Federal Reserve made last week supported the US dollar. and new problems with the spread of coronavirus infection in the EU do not make it possible for euro buyers to seriously expect large players to return to the market. But do not forget that even though the euro has fallen, the total non-commercial net position, which slightly decreased over the reporting week, still remained at a positive level. As a result, the non-commercial net position fell to 178,576 against 196,814 a week earlier.
To open short positions on EUR/USD, you need:
Sellers keep the market under their control, and all they need to do in the morning is to form a false breakout in the resistance area of 1.1695, which will increase pressure on the euro and cause the pair to fall to a low of 1.1648. The first test of this area will be accompanied by an upward rebound, but bears in this range should not have any real problems. Therefore, settling below 1.1648 forms an additional entry point into selling EUR/USD with a new goal of testing the low at 1.1585, where I recommend taking profit. In case the euro grows in the first half of the day after the release of the PMI data, it is best to postpone short positions until a false breakout forms in the resistance area of 1.1737, where the moving averages also pass, playing on the side of the bears. I recommend opening short positions in EUR/USD immediately on a rebound but only from a high of 1.1779 while aiming for a downward correction of 20-30 points by the end of the day.

Indicator signals:
Moving averages
Trading is carried out below 30 and 50 moving averages, which indicates a continuation of the bearish market for the euro.
Note: The period and prices of moving averages are considered by the author on the H1 hourly chart and differs from the general definition of the classic daily moving averages on the daily D1 chart.
Bollinger Bands
A breakout of the lower border of the indicator in the 1.1680 area will lead to a new wave of decline in the euro. Growth will be limited by the upper level of the indicator in the 1.1745 area.
Description of indicators
- Moving average (moving average, determines the current trend by smoothing out volatility and noise). Period 50. It is marked in yellow on the chart.
- Moving average (moving average, determines the current trend by smoothing out volatility and noise). Period 30. It is marked in green on the chart.
- MACD indicator (Moving Average Convergence/Divergence — convergence/divergence of moving averages) Quick EMA period 12. Slow EMA period to 26. SMA period 9
- Bollinger Bands (Bollinger Bands). Period 20
- Non-commercial speculative traders, such as individual traders, hedge funds, and large institutions that use the futures market for speculative purposes and meet certain requirements.
- Long non-commercial positions represent the total long open position of non-commercial traders.
- Short non-commercial positions represent the total short open position of non-commercial traders.
- Total non-commercial net position is the difference between short and long positions of non-commercial traders.


 Download NOW!
No comments:
Post a Comment