To open long positions on EUR/USD, you need to:
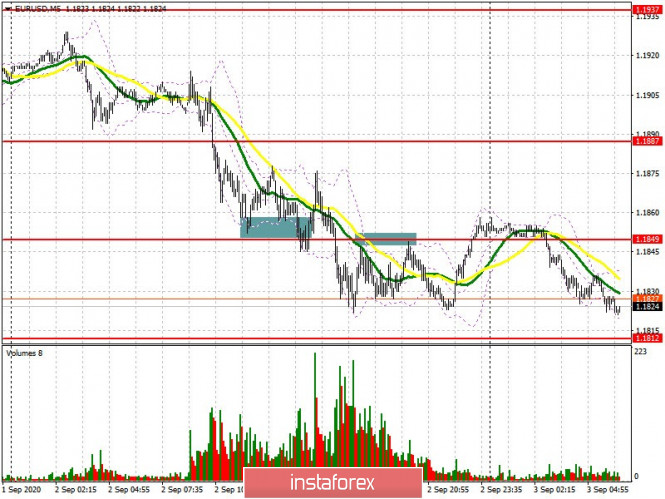
The trend towards strengthening the US dollar continued after weak fundamental reports, indicating a slowdown in the growth of the European economy. Yesterday, we formed several quite interesting points for entering the market in both buying and selling. Let's deal with them. If you look at the 5-minute chart, you will see how the bulls formed a correction of about 25 points after the first test of 1.1849 support. Even if you did not have time to enter the market at the very beginning, an additional entry point was formed when you retested this range, which also resulted in an increase of 30 points.
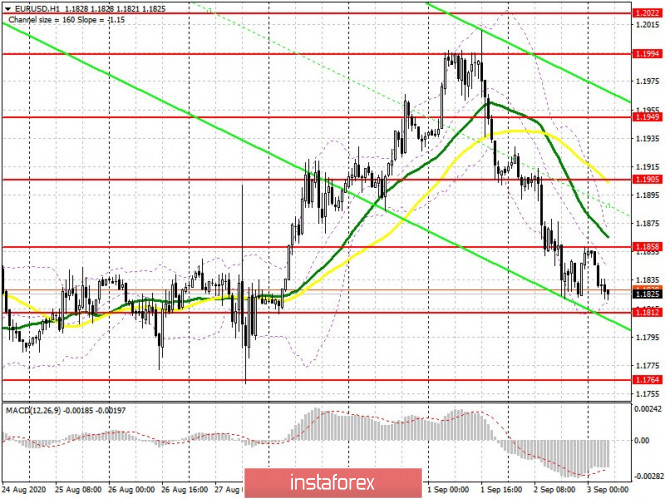
The bears achieved a breakout and gained a foothold under this level during the US session, forming two convenient market entries while testing it from top to bottom, which brought about 25 points of profit. At the moment, a very important task for euro buyers is to protect the support of 1.1812, a divergence may form on the MACD indicator while testing it, which will also be an additional buy signal. But only a false breakout of the 1.1812 area will be able to form an entry point into long positions as we count on returning to the resistance of 1.1858. A breakout and being able to settle above this range will be important, since it will provoke the removal of a number of stop orders and a more powerful bullish momentum to the area of the highs of 1.1905 and 1.1949, where I recommend taking profits.
However, take note that there are a number of reports today on activity in the services sector of the eurozone countries, and poor indicators can harm the euro. Therefore, if there is no activity in the support area of 1.1812, I recommend postponing long positions until the low of 1.1764 has been updated, or even buying EUR/USD for a rebound from the support of 1.1714 based on a correction of 20-30 points within the day.
Let me remind you that the Commitment of Traders (COT) report for August 25 recorded an increase in long non-commercial positions from 259,244 to 262,061, while short non-commercial positions fell from 62,301 to 50,309. Since closing long positions has stopped, and after a short pause, traders began to actively buy euros on the futures market, we can expect the upward trend to continue in the first half of September.

To open short positions on EUR/USD, you need:
Sellers continue to control the market and every attempt to update this week's low has been successful. Today we are waiting for reports on retail sales in the eurozone and once we ensure that activity in the service sector is slowing down, we can open short positions in the euro. Settling below the support of 1.1812 will be a clear signal to sell, counting on updating the low of 1.1764. However, the 1.1714 area will be the long term target of the sellers, which is where I recommend taking profits. In case bulls make an attempt to return to the market, it is best to open short positions only after a false breakout forms in the resistance area of 1.1858, where the moving averages that play on the side of the bears also pass. In the absence of active sales from this level and good data for the euro area, it is best to postpone short positions for a rebound from the high of 1.1905, counting on a correction of 20-30 points within the day.

Indicator signals:
Moving averages
Trading is carried out below 30 and 50 moving averages, which indicates the bears' attempt to build a downward correction for the euro.
Note: The period and prices of moving averages are considered by the author on the H1 hourly chart and differs from the general definition of the classic daily moving averages on the D1 daily chart.
Bollinger Bands
A breakout of the lower border of the indicator around 1.1812 will increase pressure on the euro. Growth will be limited by the upper level of the indicator in the 1.1860 area.
Description of indicators
- Moving average (moving average, determines the current trend by smoothing out volatility and noise). Period 50. It is marked in yellow on the chart.
- Moving average (moving average, determines the current trend by smoothing out volatility and noise). Period 30. It is marked in green on the chart.
- MACD indicator (Moving Average Convergence/Divergence — convergence/divergence of moving averages). Fast EMA period 12. Slow EMA period to 26. The 9 period SMA.
- Bollinger Bands (Bollinger Bands). The period 20.
- Non-commercial speculative traders, such as individual traders, hedge funds, and large institutions that use the futures market for speculative purposes and meet certain requirements.
- Long non-commercial positions represent the total long open position of non-commercial traders.
- Short non-commercial positions represent the total short open position of non-commercial traders.
- Total non-commercial net position is the difference between the short and long positions of non-commercial traders.


 Download NOW!
No comments:
Post a Comment