To open long positions on EUR/USD, you need:
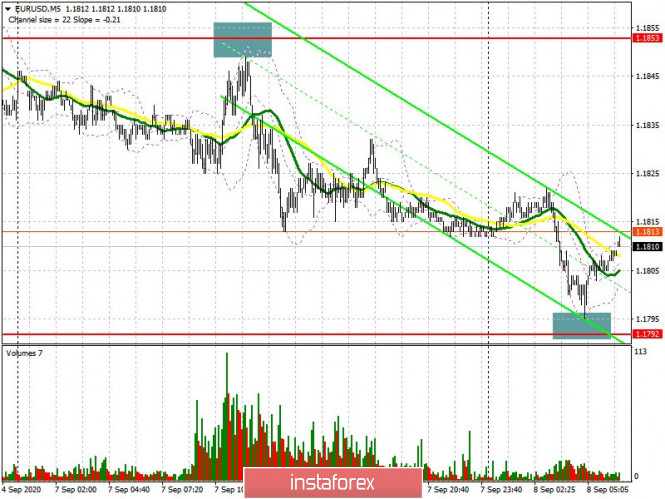
Low volume and volatility from yesterday was directly related to Labor Day in the United States. We could not wait to form a false breakout in the resistance area of 1.1853 in order to enter short positions. Also, the bulls did not reach support at 1.1792, which did not make it possible to generate a signal to buy the euro. As a result, the technical picture has slightly changed, which we will talk about below. First, we need to take note of important changes in the futures market, where the balance of power between buyers and sellers has changed, which may affect the EUR/USD pair's direction in the long-term.
The Commitment of Traders (COT) reports for September 1 showed a decrease in long non-commercial positions from 262,061 to 250,867, while short non-commercial positions increased from 50,309 to 54,130. New annual highs from the euro and the bulls' inability to break through the area above the 20th figure, which we clearly saw earlier this month, led to a sharp closure of long positions and profit taking by traders as well as a build-up of short ones. As a result, the positive non-commercial net position slightly decreased and reached 196,747, against 211,752 a week earlier.
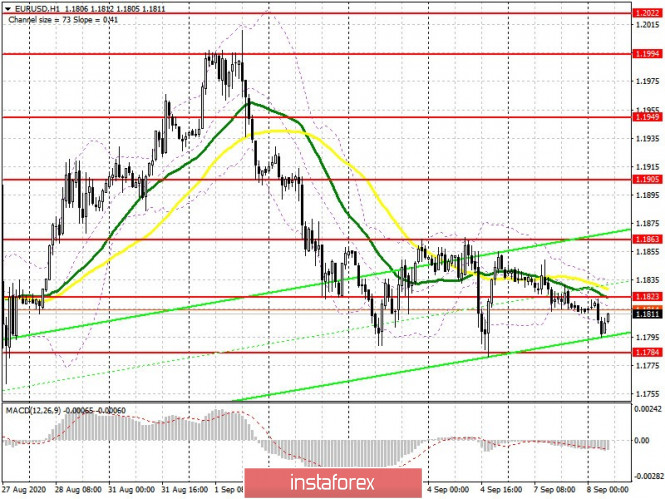
As for the current technical picture in the EURUSD pair, buyers need to urgently return the intermediate resistance level of 1.1823 to themselves, which acts as a kind of midway of the 1.1784-1.1863 side channel. Consolidating above this level forms a good entry point into long positions, which will lead to a rapid rise towards the area of the upper border of 1.1863. However, it will only be possible to talk about a change in the downward trend after a breakout of the 1.1863 range, which will open a direct road to the highs of 1.1905 and 1.1949, where I recommend taking profits. You can also consider long positions in the euro after forming the next false breakout in the area of a very large support of 1.1784, on which buyers have high hopes for. However, you should understand that in case bulls are not active at this level and the pair rapidly moves up, most likely the third test of this area will lead to its breakout. In this case, it is best to postpone long positions until a new low of 1.1750 has been updated, or buy EUR/USD immediately on a rebound from a larger support at 1.1714, counting on a correction of 20-30 points within the day.

To open short positions on EUR/USD, you need:
Today, sellers of the euro will count on weak eurozone fundamental data, as well as on a downward revision bloc's GDP for the second quarter, which will allow it to break through the area below the support of 1.1784 on its third attempt. Consolidating below this level and testing it from the bottom up will provide a good signal to open short positions in euros while hoping to fall towards the support of 1.1750, which is where I recommend taking profits. Bears will aim for the 1.1714 area in the middle of the week, considering it as the long-term target. A false breakout and unsuccessfully consolidating at the 1.1823 level, where the moving averages also pass, also forms a good entry point for short positions in hopes to continue the pair's downward trend. In case bulls are not active at this level, it is best to postpone short positions until the upper boundary of the side channel of 1.1863 has been updated and sell there on a rebound, counting on a correction of 15-20 points within the day. A larger level for sell positions is seen around 1.1905.

Indicator signals:
Moving averages
Trading is carried out below 30 and 50 moving averages, which indicates the likelihood of further decline in the euro.
Note: The period and prices of moving averages are considered by the author on the H1 hourly chart and differs from the general definition of the classic daily moving averages on the D1 daily chart.
Bollinger Bands
A breakout of the lower border of the indicator around 1.1795 will increase pressure on the euro. A breakout of the upper border of the indicator in the 1.1830 area will lead to a sharper rise in the euro.
Description of indicators
- Moving average (moving average, determines the current trend by smoothing out volatility and noise). Period 50. It is marked in yellow on the chart.
- Moving average (moving average, determines the current trend by smoothing out volatility and noise). Period 30. It is marked in green on the chart.
- MACD indicator (Moving Average Convergence/Divergence — convergence/divergence of moving averages) Fast EMA period 12. Slow EMA period to 26. SMA period 9
- Bollinger Bands (Bollinger Bands). Period 20
- Non-commercial speculative traders, such as individual traders, hedge funds, and large institutions that use the futures market for speculative purposes and meet certain requirements.
- Long non-commercial positions represent the total long open position of non-commercial traders.
- Short non-commercial positions represent the total short open position of non-commercial traders.
- Total non-commercial net position is the difference between short and long positions of non-commercial traders.


 Download NOW!
No comments:
Post a Comment