
Gold price made a higher weekly high than last week, but price got under pressure and closed in negative territory. Price continues to hold inside the long-term bullish channel and above the key short-term support of $1,900-$1,920.
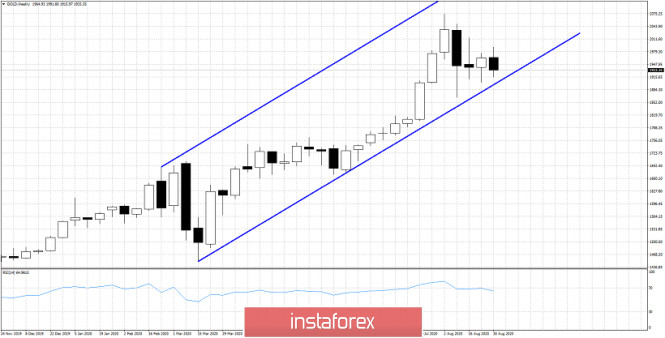
Gold price the last three weeks is mostly moving sideways after making a high at $2,074. As long as price holds above recent week's lows, we should expect another run higher towards $2,100 and higher. First important obstacle for bulls is the $1,992 high of this past week. A weekly close above it will increase the chances of seeing $2,100 and higher. Breaking below $1,900 will open the way for a pull back towards $1,850-$1,800.
The material has been provided by InstaForex Company - www.instaforex.com


 Technical Overview and Price Action The EUR/USD pair is exhibiting a rebound from the 1.1409 Fibonacci support level on the hourly chart, cu...
 Market Overview and Technical Status Ethereum (ETH/USD) is currently trading at approximately $1,786. The asset is maintaining a position ab...
 Market Overview The EUR/USD pair is currently trading near 1.1420, maintaining a position above the 21-period Simple Moving Average (SMA) fo...
 Market Overview and Sentiment Despite rising US-Iran tensions and increased oil prices, financial markets have largely decoupled from geopol...
 Market Overview and Geopolitical Context The EUR/USD pair is entering a week of potential volatility driven by an intersection of geopolitic...


 Download NOW!
No comments:
Post a Comment