EUR/USD 1H

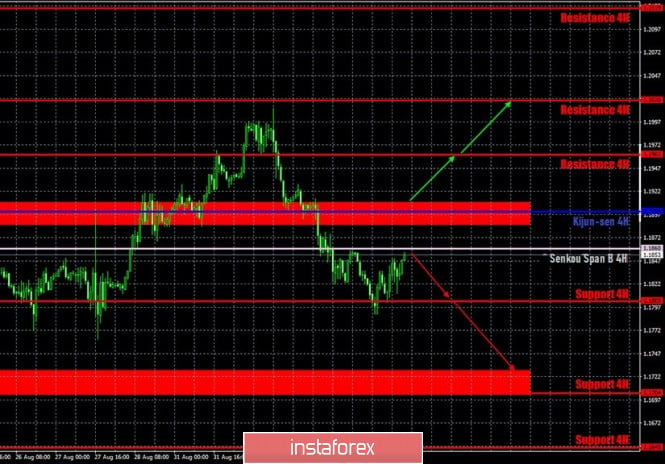
The hourly timeframe on September 3 shows that the euro/dollar pair reached the first support level of 1.1803 and failed to overcome it. Therefore, a correction is overdue, after the euro fell for almost two days. We continue to hope that the current downward movement from the 1.2000 level is a correction against the euro's three-month growth, which has been brewing for more than a month. One way or another, the bears got another chance to move down. To do this, they need to stay below the Senkou Span B line, then today, September 4, the quotes can fall to the level that previously served as the lower border of the side channel – 1.1700.
EUR/USD 15M

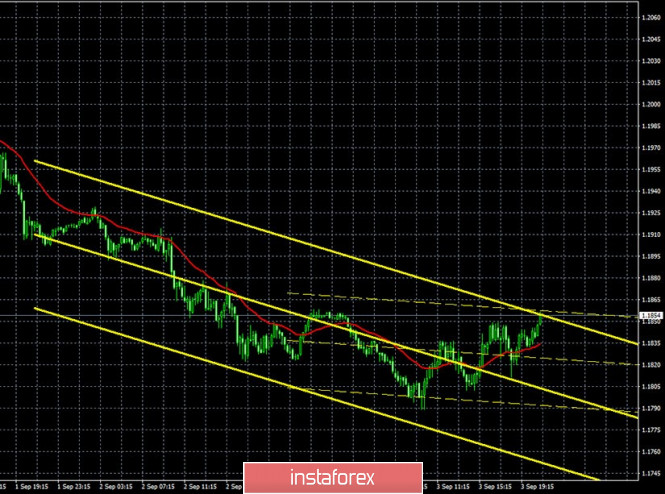
Both linear regression channels are directed downward on the 15 minute timeframe, signaling a downtrend now. A new Commitments of Traders (COT) report was released last Friday. Take note that its pattern has not changed at all compared to previous COT reports. Professional traders continue to increase their net position despite the fact that the euro/dollar has been trading within the side channel for more than a month. In other words, non-commercial traders (the most important group of traders) are increasing the number of Buy-contracts, while the number of Sell-contracts is decreasing. The non-commercial category of traders opened 1,302 Buy-contracts and closed 11,310 Sell contracts during the reporting week on August 19-25. Thus, the net position (the difference between the number of Buy and Sell contracts) increased by 12,000. Therefore, we can draw the same conclusions as a week ago and two weeks ago: professional traders continue to view the euro as a more attractive currency to invest in than the US dollar. The euro continued to steadily grow for five trading days (August 26-September 1), which will be included in the next COT report. The fall only began on the evening of September 1, thus, it is unlikely that the new report will reflect the fall in the euro's quotes. Moreover, as before, the euro has not sharply fallen. All the same notorious 200 points.
The eurozone released several business activity indices for the services sector of European countries, as well as for the EU as a whole on Thursday, September 3. We can immediately say that traders were not impressed by the figures, as they did not signal any major changes. Therefore, the retail sales report was more important, which showed a drop in volumes by 1.3% in July instead of an increase of 1.3%. This may have helped the European currency, which has been moderately rising for most of the day. As for US data, the number of secondary applications for unemployment benefits reached 13,254,000, which is much lower than the previous value and forecast. This means that real unemployment continues to fall, which is good for the dollar. In addition, the business activity index for the ISM services sector remained at a high level, which, as we feared, may begin to decline due to the ongoing coronavirus epidemic in the United States. However, this news did not provide any support to the US currency. It can do so tomorrow, if the reports on unemployment and Nonfarm Payrolls do not turn out to be weak, as the report from ADP in the middle of the week.
We have two trading ideas for September 4:
1) Bulls continue to take profits after reaching the 1.2000 level and do not intend to return with new long deals yet. Since the price has settled below the Kijun-sen and Senkou Span B lines, which are the two strongest lines of the Ichimoku indicator, it is not recommended to open new purchases until the price settles above the 1.1886-1.1910 area. In this case, long positions will again be relevant with the targets at the resistance levels of 1.1961 and 1.2020. Take Profit in this case will be from 30 to 90 points.
2) Bears got an opportunity to start forming a new downward trend, as they managed to gain a foothold below the Senkou Span B line (1.1860). If, following the results of night and morning trading, they manage to stay below this line, then downward trading can resume with targets at the level of 1.1803 and the support area of 1.1705-1.1728. In this case, the potential Take Profit ranges from 30 to 100 points.
Explanations for illustrations:
Support and Resistance Levels are the levels that serve as targets when buying or selling the pair. You can place Take Profit near these levels.
Kijun-sen and Senkou Span B lines are lines of the Ichimoku indicator transferred to the hourly timeframe from the 4-hour one.
Support and resistance areas are areas from which the price has repeatedly rebounded off.
Yellow lines are trend lines, trend channels and any other technical patterns.
The material has been provided by InstaForex Company - www.instaforex.com


 Download NOW!
No comments:
Post a Comment