GBP/USD 1H

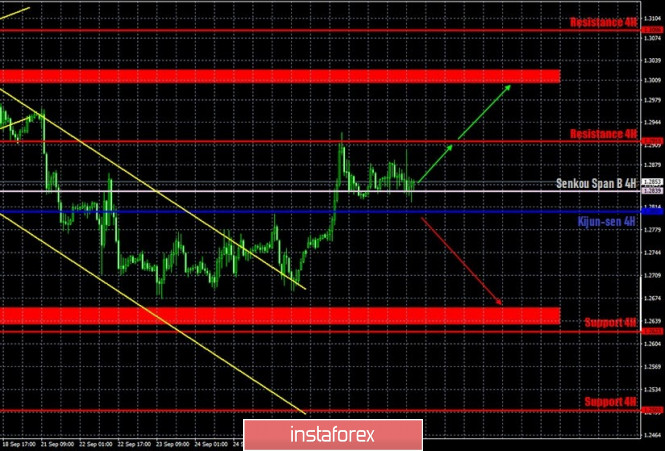
The GBP/USD pair was in a narrow price range between the Senkou Span B line and the resistance level of 1.2915 on September 29. The technical picture has not changed after the previous day. Buyers have taken some important steps forward, but now they need to go beyond the 1.2915 level to expect something more. The bears have a good chance of returning to the market, but they need to take the pair back below the Senkou Span B and Kijun-sen lines. The general trend is more uncertain, as there is no pronounced upward trend now.
GBP/USD 15M

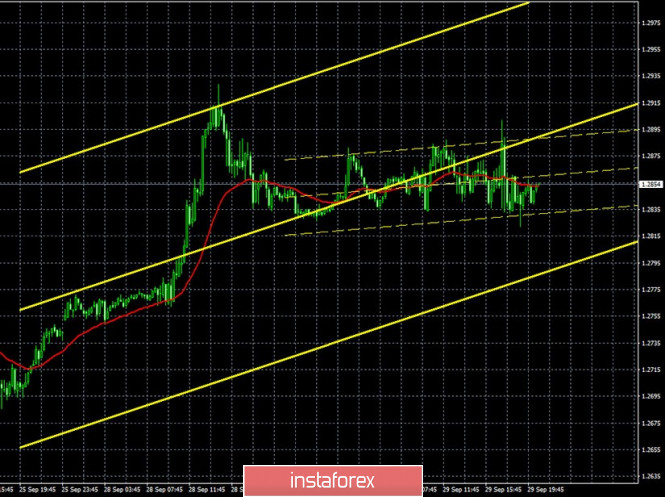
Both linear regression channels are directed to the upside on the 15-minute timeframe, responding to a strong rise on Monday and a horizontal movement on Tuesday. The latest Commitment of Traders (COT) report for the British pound showed that non-commercial traders got rid of buying the pound and opened Sell-contracts (shorts). A group of commercial traders got rid of huge amounts of both longs and shorts of the pound. We then concluded that the pound sterling is now, in principle, not the most attractive currency for large traders. The new COT report showed absolutely minor changes for the "non-commercial" group. Buy-contracts (longs) fell by 2,000 while Sell-contracts decreased by 1,500. Thus, the net position for non-commercial traders remained practically unchanged for the reporting week (September 16-22). The British pound continued to fall, which can be considered a consequence of the previous reporting week, when the net position of non-commercial traders greatly decreased, by 11,500 contracts. No changes in the rate of the pound/dollar pair on the 23rd, 24th, 25th, which will be included in the next report. Thus, a long term decline in the pound's quotes is quite questionable, although the pound is still the most unattractive currency in the foreign exchange market.
Quite big news for the British pound on Tuesday, September 29. Nevertheless, the overall fundamental background remains very strong for the pound. Today or tomorrow, and in principle every day, the market may receive news from the negotiations between Brussels and London, news about the parliamentary vote on the "Johnson Bill", as well as any other information about the relationship between the UK and the EU, current and future. All this information is extremely important for the pound. Both the UK and the US will publish their third quarterly GDP estimates today. The United States is expected to fall by 31.7%, and Britain - by 20.4%. There will be other important macroeconomic reports in America, as well as the debate between Donald Trump and Joe Biden. Therefore, volatility may sharply increase during the day, since there might be a large amount of potentially important news.
We have two trading ideas for September 30:
1) Buyers continue to push the pair upward and crossed the Kijun-sen and Senkou Span B lines the day before yesterday, and also reached the first resistance level of 1.2915. Thus, you are advised to stay in long positions while aiming for the resistance level of 1.2915 and the resistance area of 1.3004-1.3024, while the pair remains above the Senkou Span B line. Take Profit in this case will be from 50 to 140 points. The current fundamental background is simultaneously bad for both the pound and the dollar.
2) Sellers failed to keep the pair below the critical line. So now they need to wait for the price to settle below the Kijun-sen line (1.2807), and only after that should you resume trading downward while aiming for the support area of 1.2636-1.2660. Take Profit in this case can be up to 110 points.
Explanations for illustrations:
Support and Resistance Levels are the levels that serve as targets when buying or selling the pair. You can place Take Profit near these levels.
Kijun-sen and Senkou Span B lines are lines of the Ichimoku indicator transferred to the hourly timeframe from the 4-hour one.
Support and resistance areas are areas from which the price has repeatedly rebounded off.
Yellow lines are trend lines, trend channels and any other technical patterns.
The material has been provided by InstaForex Company - www.instaforex.com


 Download NOW!
No comments:
Post a Comment