
The pair traded downward on Wednesday and tested the support level 1.2885 (red bold line) and went up, closing the day with a white candle. Today, the price may continue to move up. Economic calendar news for the dollar is expected at 12:30 and 15:00 UTC.
Trend analysis (Fig. 1).
The market may continue to move upward from the level of 1.3002 (closing of yesterday's daily candlestick) with the target of 1.3138 - a 21-day EMA (black thin line). In case of testing this level, the upward trend may continue with the next target of 1.3209 - an 85.4% pullback level (blue dotted line).
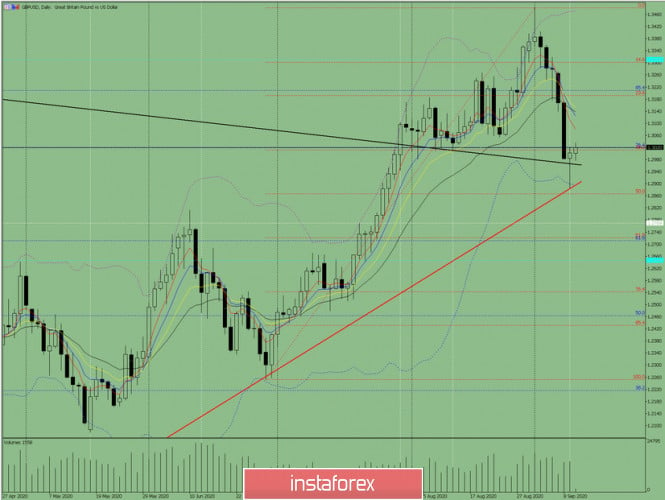
Figure: 1 (daily chart).
Comprehensive analysis:
- Indicator analysis - up;
- Fibonacci levels - up;
- Volumes - up;
- Candlestick analysis - up;
- Trend analysis - up;
- Bollinger lines - up;
- Weekly chart - up.
General conclusion:
Today, the price may continue to move upward with the target of 1.3138 - a 21-day EMA (black thin line). In case of testing this level, the upward trend may continue with the next target of 1.3209 - an 85.4% pullback level (blue dotted line).
Another possible scenario is from the level of 1.3002 (closing of yesterday's daily candle), the price may move downward with the target at the support level 1.2885 (red bold line). If this level is reached, the price may begin to move upward.
The material has been provided by InstaForex Company - www.instaforex.com


 Market Overview and Technical Status Ethereum (ETH/USD) is currently trading at approximately $1,786. The asset is maintaining a position ab...
 Technical Overview and Price Action The EUR/USD pair is exhibiting a rebound from the 1.1409 Fibonacci support level on the hourly chart, cu...
 GBP/USD Performance and Correction Overview The GBP/USD pair reached a two-month high of 1.3557 on Wednesday before undergoing a technical p...
 Market Overview and Technical Outlook US equity markets are exhibiting signs of fatigue as concerns regarding overextended valuations in the...
 Market Overview and Geopolitical Context The EUR/USD pair is entering a week of potential volatility driven by an intersection of geopolitic...


 Download NOW!
No comments:
Post a Comment