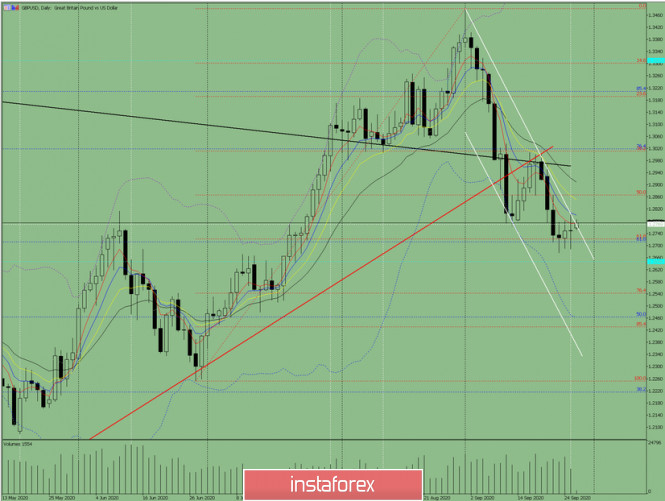
The pair traded upward on Friday and rebounded at the resistance level 1.2805 (white thick line) then went down. Today, the price is likely to continue its upward movement. No news is expected as per the economic calendar.
Trend analysis (Fig. 1).
The market may move upward from the level of 1.2748 (closing of Friday's daily candlestick) with the target of 1.2909 - a 21-day EMA (black thin line). If this level is tested, the upward trend may continue with the next target at the resistance level 1.2961 (black bold line).

Figure: 1 (daily chart).
Comprehensive analysis:
- Indicator analysis - up;
- Fibonacci levels - up;
- Volumes - up;
- Candlestick analysis - up;
- Trend analysis - up;
- Bollinger lines - up;
- Weekly chart - up.
General conclusion:
Today, the price may move upward with the target of 1.2909 - a 21-day EMA (black thin line). If this level is tested, the upward trend may continue with the next target at the resistance level 1.2961 (black bold line).
Another possible scenario: from the level of 1.2748 (closing of Friday's daily candlestick), the price may begin to move down with the target at the historical support level 1.2646 (blue dashed line).
The material has been provided by InstaForex Company - www.instaforex.com


 We introduce you to the daily updated section of Forex analytics where you will find reviews from forex experts, up-to-date monitoring of fi...


 Download NOW!
No comments:
Post a Comment