EUR/USD
Analysis:
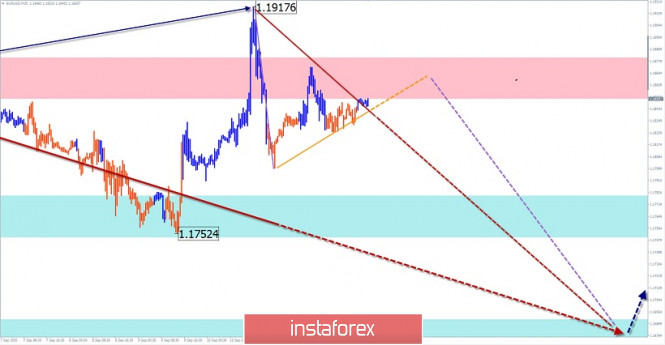
As part of the dominant upward wave, a horizontal correction has been forming on the European currency chart since the end of July. Moreover, it looks like a stretched plane. The wave has entered its final phase and the structure lacks the last descending section.
Forecast:
In the coming session, a change in the price movement rate is expected. Before the reversal, pressure may be applied to the resistance zone. Increased movement and further decline are likely at the end of the day.
Potential reversal zones
Resistance:
- 1.1850/1.1880
Support:
- 1.1780/1.1750
- 1.1690/1.1660
Recommendations:
There are no conditions for purchases on the euro market. Sales are possible within the intraday. It is worth considering the short-term nature of the current decline in the pair.

AUD/USD
Analysis:
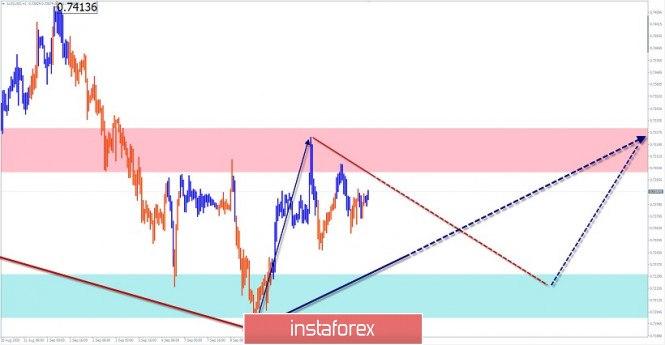
The Australian dollar chart has been dominated by a bullish trend since March. The last section started on August 20. Since September 1, a downward movement is formed. This wave does not go beyond the correction of the last trend section. The bullish section from September 9 has a reversal potential.
Forecast:
Today, the price is expected to move in the corridor between the nearest zones. In the first half of the day, pressure on the resistance zone is not excluded. Then you should wait for the exchange rate change and the price move to the support zone.
Potential reversal zones
Resistance:
- 0.7300/0.7330
Support:
- 0.7230/0.7200
Recommendations:
Trading on the pair's market today is only possible during trading sessions. At the same time, it is more reasonable to reduce the lot. Sales of the tool remain the priority.

GBP/JPY
Analysis:
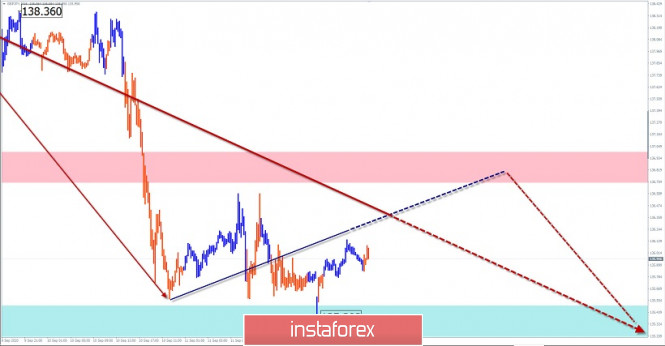
The chart of the British cross since mid-March is dominated by an upward wave of the daily scale. Since the beginning of June, a counter correction has been developing. According to Elliott, this is a shifting plane. To date, the structure looks complete, however, there are no signals of a change of course. The price is within a strong potential reversal zone.
Forecast:
Today, the price is expected to move in the side corridor between the opposite zones. At the European session, pressure on support zones is possible. A change of course is likely in the afternoon.
Potential reversal zones
Resistance:
- 136.70/137.00
Support:
- 135.50/135.20
Recommendations:
According to the expected sequence, short-term trading transactions are possible in the pair's market today. We recommend reducing the lot size.

Explanation: In the simplified wave analysis (UVA), waves consist of 3 parts (A-B-C). The last incomplete wave is analyzed. The solid background of the arrows shows the formed structure, and the dotted background shows the expected movements.
Note: The wave algorithm does not take into account the duration of the instrument's movements in time!
The material has been provided by InstaForex Company - www.instaforex.com


 Download NOW!
No comments:
Post a Comment