Crypto Industry News:
According to Chainalysis, bitcoins are sent to exchanges, but they don't find a place in their order books. This would mean that market participants send their cryptocurrency to exchanges to sell it, but are not yet blocking it on orders. Instead, they wait for the price to rise.
Trading intensity analyzes two variants of stock market data. It is about the number of BTC in the order books of the exchange in relation to the number of coins sent to the exchanges. A high value for trade intensity would mean that many BTC orders are placed on exchanges for a small amount of bitcoins sent to exchanges, while a low value for trade intensity would indicate otherwise. At the time of writing this publication, the median BTC trading intensity was 2.13. This is the lowest level in a year.
Chainalysis data also suggests that the BTC value sent to exchanges is quite high at the moment. According to Chainalysis data, there has been a change of 26.36 BTC in bitcoin held on exchanges, which is not only positive but above the 180-day average. Hence, from the point of view of trading intensity, this makes the number of BTC in exchange order books low or relatively lower than the increase in the number of bitcoins stored on exchanges.
Looking at it in the context of a price scenario can reveal where market participants expect the next price increase. Since a large number of bitcoins are traded on exchanges but have not yet been sold or placed to place an order, the breeder and trader expect the price to rise. When the price rises as there are more inflows to the exchanges than the payouts, a selling frenzy would ensue.
Market Participants therefore seem to be waiting for prices to rise to their preferred level in order to start their sell orders and cash in their profits. However, this may prove to be a problem when prices rise significantly.
Technical Market Outlook:
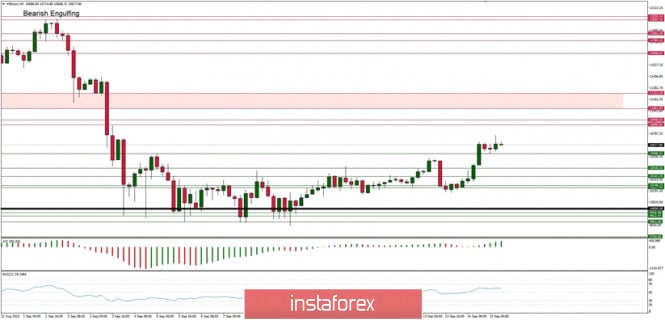
The BTC/USD pair has made a new local high at the level of $10,883 recently, but it does not look like the bulls want to continue the rally as the momentum had decreased significantly. If there is no breakout higher in the coming days, then the market might be moving sideways for some time and event reverse again. The nearest technical resistance is seen at the level of $10,890 and $10,940 and the key short-term technical support is seen at the level of $9,922. The weekly time frame trend remains up.
Weekly Pivot Points:
WR3 - $11,302
WR2 - $10,908
WR1 - $10,609
Weekly Pivot - $10,206
WS1 - $9,887
WS2 - $9,466
WS3 - $9,157
Trading Recommendations:
The weekly trend on the BTC/USD pair remains up and there are no signs of trend reversal, so buy orders are preferred in the mid-term. All the dynamic corrections are still being used to buy the dips. The next mid-term target for bulls is seen at the level of $13,712. The key mid-term technical support is seen at the level of $10,000.


 Download NOW!
No comments:
Post a Comment