Technical Market Outlook:
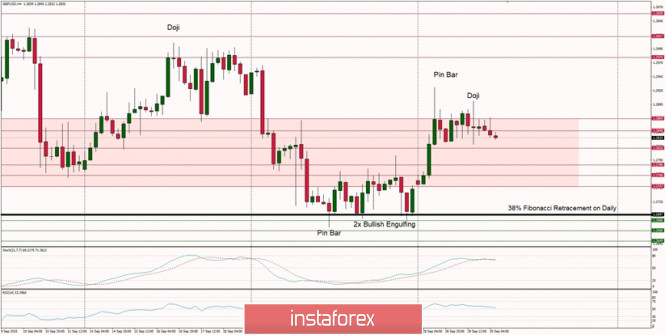
After making a new local high at the level of 1.2926, the GBP/USD pair has been consolidating in a narrow zone around the wave high, but eventually the market has made a Doji candlestick pattern and started to reverse. The current intraday technical support is seen at the levels of 1.2816, 1.2786. 1.2768 and 1.2747. The momentum is still strong and positive, but the market is about to enter the overbought zone, so the level of 1.2926 might be a top of the bounce. Only a sustained move above the level of 1.3000 would put the bulls back in control over the market. The weekly time frame trend remains up.
Weekly Pivot Points:
WR3 - 1.3187
WR2 - 1.3072
WR1 - 1.2894
Weekly Pivot - 1.2783
WS1 - 1.2601
WS2 - 1.2494
WS3 - 1.2312
Trading Recommendations:
On the GBP/USD pair the main, multi-year trend is down, which can be confirmed by the down candles on the monthly time frame chart. The key long-term technical resistance is still seen at the level of 1.3518. Only if one of these levels is clearly violated, the main trend might reverse (1.3518 is the reversal level) or accelerate towards the key long-term technical support is seen at the level of 1.1903 (1.2589 is the key technical support for this scenario).


 Download NOW!
No comments:
Post a Comment