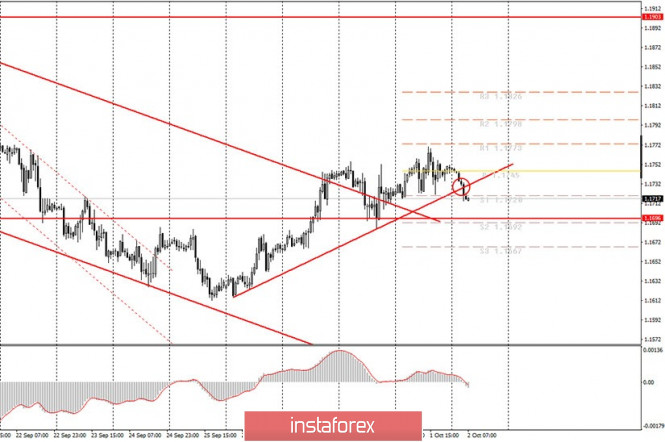
Hourly chart of the EUR/USD pair

The EUR/USD pair started a new downward movement last night, which led to price taking below the upward trend line. This is exactly what we have been talking about in the past few days. Almost any round of correction will lead to price taking below the trend line. Now we can only guess if this is a new round of correction, after which the upward movement will resume, or is it the beginning of a new downward trend? One way or another, but you can try to reject the new signal that is encircled. We still recommend traders to be very careful, because trading the pair has recently been inconvenient and difficult, especially for novice traders.
The fundamental background for the US currency remains rather complex and has not changed in recent days. Thus, the dollar's growth (the fall of the euro/dollar pair) is still in doubt. This does not mean that the US dollar is not able to go down even 100 points now. On the hourly chart, we can see an even stronger fall, since 100 points is not even a move. We mean that the dollar is unlikely to strengthen this month, for example, by 300 or 400 points. The situation is moving smoothly towards the presidential election, which is still the most important topic in the United States. As for the vital news, there are very few of them from America right now, and all of them, as they say, are "past the box office". For example, the news that Democrats and Republicans decided to try to come to an agreement on a financial aid package for the US economy, is that good news given that it should have been agreed and signed back in early August?
Market participants continue to ignore macroeconomic data, but two rather important reports will be published today and novice traders should also pay attention to them. Firstly, we are talking about inflation in the European Union, which has recently been called deflation, and secondly, about the NonFarm Payrolls report, which will be released in the United States in the afternoon. Let's say right away that we do not expect any market reaction to the inflation report, we have a 50/50 likelihood that they will pay attention to the case of the NonFarm Payrolls report. The market continues to ignore any statistics. However, the report on the number of new jobs created outside the agricultural sector is still very important, so traders can make an exception today. The forecast is 850,000 new jobs. Any value exceeding the forecast by 100,000 or more will make it possible for the dollar to grow significantly. But market participants might just brush it off if it's only a small deviation from the forecast.
Possible scenarios for October 2:
1) Buy positions quickly lost their relevance, since the price has already settled below the upward trend line. Nevertheless, there is still a possibility that the current downward movement is a correction, after it has ended the upward movement will resume, and the trend line will simply be rebuilt. But for now, we do not recommend opening long positions.
2) Selling became relevant again on Friday morning, as the price broke the trend line. Now we recommend trading the pair down while aiming for 1.1692 and 1.1667. Bearing in mind that the current movement may be a round of correction, since an important US report will be released in the afternoon, the reaction to which may be unpredictable. We recommend novice traders to not forget about Stop Loss levels. Ahead of the release of the NonFarm Payrolls report, if there is even a small profit on the deal, you can close it, or set Stop Loss to breakeven.
On the chart:
Support and Resistance Levels are the Levels that serve as targets when buying or selling the pair. You can place Take Profit near these levels.
Red lines are the channels or trend lines that display the current trend and show in which direction it is better to trade now.
Up/down arrows show where you should sell or buy after reaching or breaking through particular levels.
The MACD indicator (10,20,3) consists of a histogram and a signal line. When they cross, this is a signal to enter the market. It is recommended to use this indicator in combination with trend lines (channels and trend lines).
Important announcements and economic reports that you can always find in the news calendar can seriously influence the trajectory of a currency pair. Therefore, at the time of their release, we recommended trading as carefully as possible or exit the market in order to avoid a sharp price reversal.
Beginners on Forex should remember that not every single trade has to be profitable. The development of a clear strategy and money management are the key to success in trading over a long period of time.
The material has been provided by InstaForex Company - www.instaforex.com


 Download NOW!
No comments:
Post a Comment