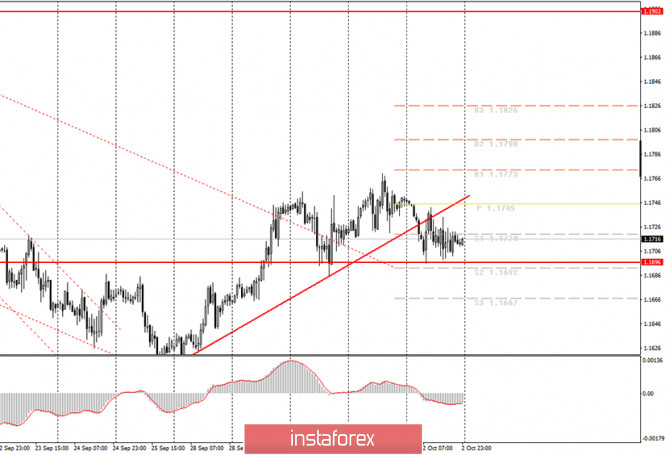
Hourly chart of the EUR/USD pair.

On Friday, October 2, it was again quite difficult to trade the EUR/USD currency pair, especially for novice traders. If in the last few days the movements were non-standard, then there was no correction, "swing", and frequent rollbacks. Therefore, in the end, the upward trend was broken, as the price was fixed below the upward trend line. Further, on Friday, there was a frank flat (movement in a narrow price range without a certain direction). It is not recommended for anyone to trade in a flat, as it is very difficult to make a profit from the sideways movement. Thus, there are several conclusions to be drawn after Friday. First, the upward trend is broken. Secondly, traders failed to gain a foothold below the level of 1.1696, and this level again begins to support the euro/dollar pair. Third, it is now almost impossible to predict the further movement of the pair even in the coming days. Fourth, Friday's macroeconomic data did not have any impact on the course of trading.
During the last trading day of this week, quite a lot of macroeconomic statistics were published. For example, the European Union released another report on inflation, which showed an even greater slowdown in the main indicator, to -0.3% y/y. This is the third consecutive month of deflation in the Eurozone. This is bad news for the euro, however, market participants did not think so. Further. In America, an extremely important report on NonFarm Payrolls (the number of new jobs created outside of agriculture) was published, however, it did not cause any reaction from the markets. The actual value of the report was lower than forecasts and the previous value, which means that the US dollar should have fallen in price. The unemployment rate in America fell to 7.9%, however, the fact that this indicator continues to decline was clear from the reports on the number of secondary applications for unemployment benefits, which we discussed on Thursday. And we have listed only the most important reports of the day. There was also a report on changes in the level of wages in the United States, the University of Michigan consumer confidence index, and others. However, macroeconomic statistics simply continue to be ignored.
On Monday, October 5, the European Union, some EU countries, and the United States are scheduled to publish indices of business activity in the service sector. In the current environment, these reports are not of high significance. On Friday, the markets ignored much more significant data. Thus, we believe that only frankly bad values of these indicators can cause a reaction, that is, values below 50.0. The European Union will also publish a report on retail sales for August, however, it is unlikely to have any impact on the course of trading. Most of the market attention is now focused on Donald Trump being infected with "coronavirus", just a month before the presidential election.
On October 5, the following scenarios are possible:
1) Since the upward trend line was overcome by traders, purchases of the euro/dollar pair have now ceased to be relevant. At the same time, the current technical picture looks so ambiguous that it allows for various scenarios. For example, an upward trend line can be rebuilt. However, at the moment, we do not recommend opening buy positions for novice traders.
2) Sales of the pair became relevant after the price was fixed below the trend line, however, the level of 1.1696 kept the pair from falling further. This is not the first time. Thus, we recommend opening new sales of the euro/dollar pair if traders manage to gain a foothold below this level. The nearest target is the support level of 1.1667.
What's on the chart:
Price support and resistance levels - the target levels when opening purchases or sales. You can place Take Profit levels near them.
Red lines – channels or trend lines that display the current trend and indicate which direction is preferable to trade now.
Up/down arrows - show when you reach or overcome which obstacles you should trade up or down.
MACD indicator (14,22,3) is a histogram and a signal line, the intersection of which is a signal to enter the market. It is recommended to use it in combination with trend lines (channels, trend lines).
Important speeches and reports (always included in the news calendar) can greatly influence the movement of the currency pair. Therefore, during their exit, it is recommended to trade as carefully as possible or exit the market in order to avoid a sharp reversal of the price against the previous movement.
Beginners in the Forex market should remember that every trade cannot be profitable. The development of a clear strategy and money management are the key to success in trading over a long period of time.
The material has been provided by InstaForex Company - www.instaforex.com


 Download NOW!
No comments:
Post a Comment