EUR/USD 1H

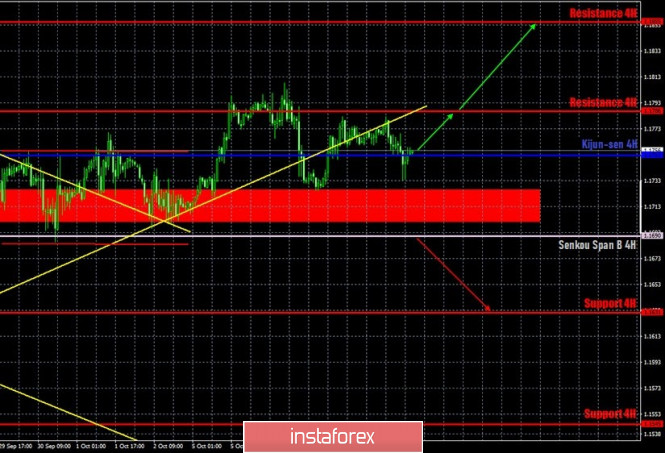
The euro/dollar pair continued to trade in a back and forth style on the hourly timeframe on October 8. The pair's quotes crossed the critical Kijun-sen line several times over the past few days, so it simply ceased to be relevant. But we can draw a conclusion about the flat in the short term. Trades from the past few days are strictly between the support area of 1.1701-1.1725 and the resistance level of 1.1786, in a range of only 60 points wide. Therefore, the flat will persist until traders manage to pull the pair out of this range. Sellers can seriously be active below the Senkou Span B line. However, we still need to try to get away below this line, given the general negative attitude towards the dollar at this time.
EUR/USD 15M

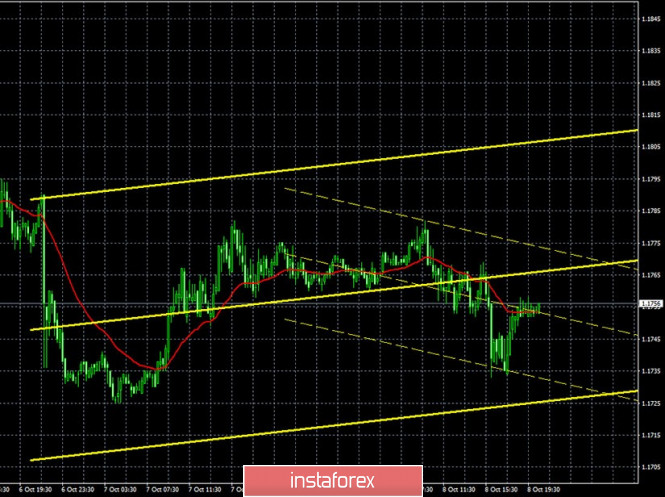
The lower linear regression channel turned to the downside on the 15-minute timeframe, while the higher one turned up. This suggests that the upward movement may resume in the short term. However, both channels can change directions too often unless the price leaves the horizontal channel on the hourly timeframe.
COT report

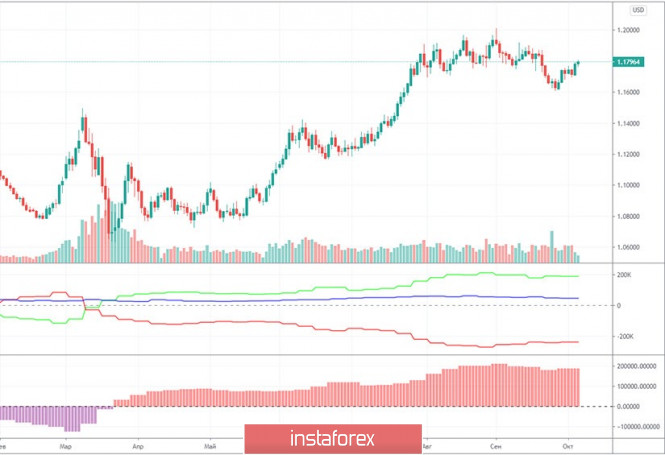
The EUR/USD pair grew by around 30 or 40 points during the last reporting week (September 23-29). We can't even call it growth, just common market noise. The previous Commitment of Traders (COT) report showed that non-commercial traders opened 15,500 new Buy-contracts (longs) and almost 6,000 Sell-contracts (shorts). Thus, the net position for this group of traders increased by around 9,000. The new report clearly reflects what is currently happening in the foreign exchange market. Professional traders closed 4,500 contracts for buy positions on the euro and 3,300 contracts for sell positions during the reporting week. That is, the net position for the "non-commercial" group has decreased by around a thousand contracts, which means that the mood of large traders has become a little more bearish. However, these are not changes that can be acknowledged as global. Therefore, we conclude that the situation has not changed dramatically. The EUR/USD pair generally stood in one place for the next three trading days (after September 29). Therefore, the next COT report may also show minimal changes in the mood of professional traders. Looking at the chart showing the net positions of all categories of traders, we can conclude that a major downward reversal is brewing for the euro. Usually, when the green and red lines are far away from each other, it is the harbingers of a global reversal.
No important and significant publications of macroeconomic data on October 8, Thursday. European Central Bank Vice President Luis de Guindos' speech was not informative. The only report of the day - on applications for unemployment benefits in the US was slightly more optimistic than forecasts. Nevertheless, we can say that the US unemployment rate continues to decline. The dollar even received traders' support after the release of this report. 20-30 points. The macroeconomic events calendar is generally empty on the last trading day of the week. However, as it often happens, strong movement begins when no one is waiting for it. Let us remind you that market participants are not only ordinary small traders, but also large players who form the bulk of supply and demand. Thus, if, figuratively speaking, the ECB wants to buy 200 billion dollars, then the demand for the US currency will sharply increase, and with it the rate of the dollar itself.
We have two trading ideas for October 9:
1) Trading has recently been extremely vague and very similar to a flat. Formally, buyers can continue to trade the pair upward with targets at the resistance levels of 1.1786 and 1.1855 as long as the price is above the Kijun-sen line (1.1752), but only in small lots and in extreme caution, since the rising line the trend has been overcome. Take Profit in this case will be from 20 to 80 points.
2) Bears have not been able to build on their success and gain a foothold below the support area of 1.1701-1.1725. Thus, we advise traders to wait for this area and until we overcome the Senkou Span B line (1.1690) in order to be able to open new short positions with 1.1631 as a goal. In this case, the potential Take Profit is up to 50 points.
Explanations for illustrations:
Support and Resistance Levels are the levels that serve as targets when buying or selling the pair. You can place Take Profit near these levels.
Kijun-sen and Senkou Span B lines are lines of the Ichimoku indicator transferred to the hourly timeframe from the 4-hour one.
Support and resistance areas are areas from which the price has repeatedly rebounded off.
Yellow lines are trend lines, trend channels and any other technical patterns.
The material has been provided by InstaForex Company - www.instaforex.com


 Download NOW!
No comments:
Post a Comment