
Trend Analysis (Figure 1)
Today, the market may begin moving up from the level of 1.1808 (closing of yesterday's daily candle) with the goal of 1.1853, which is a pullback level of 61.8% (blue dotted line). Upon testing this level, the price will further work up, with the goal of 1.1876 - the resistance line (blue dotted line).
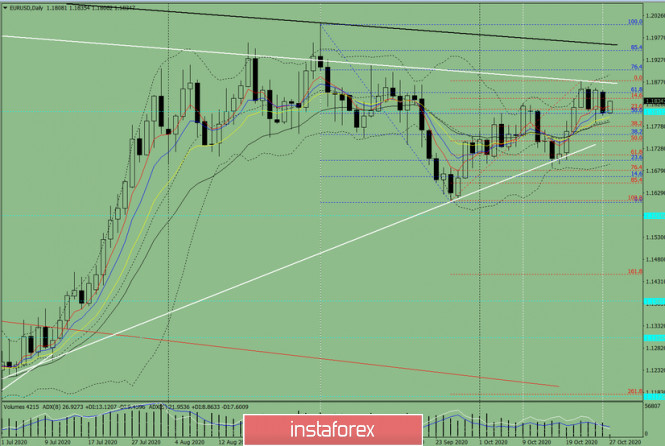
Figure 1 (Daily chart)
Comprehensive analysis:
- Indicator analysis - up
- Fibonacci levels - up
- Volumes - up
- Candlestick analysis - up
- Trend analysis - up
- Bollinger Bands - up
- Weekly chart - down
General conclusion:
Today, the price from the level of 1.1808 (closing of yesterday's daily candle) may continue to move up with the goal of 1.1853, which is a pullback level of 61.8% (blue dotted line). Upon testing this level, the price will further work up, with the goal of 1.1876 - the resistance line (blue dotted line).
Unlikely scenario: when working up to reach the pullback level of 61.8%, which is 1.1853 (blue dotted line), work down with the goal of 1.1777, which is a pullback level of 38.2% (red dotted line).
The material has been provided by InstaForex Company - www.instaforex.com


 Fresh from RobotFX: in-depth analysis to support your trading decisions. The GBP/USD currency pair continued to trade upward on Tuesday...
 Fresh from RobotFX: in-depth analysis to support your trading decisions. The wave pattern on the 4-hour chart has changed. There is sti...
 RobotFX brings you curated forex insights to help you navigate current market conditions effectively. The economic calendar for the upcoming...
 In the ever-changing forex market, staying informed is crucial for success. Here's the latest professional analysis from RobotfFX. ...
 Professional traders know the value of timely analysis. Enjoy this expert forex review. The wave pattern on the 4-hour chart for EUR/US...


 Download NOW!
No comments:
Post a Comment