EUR/USD
Analysis:
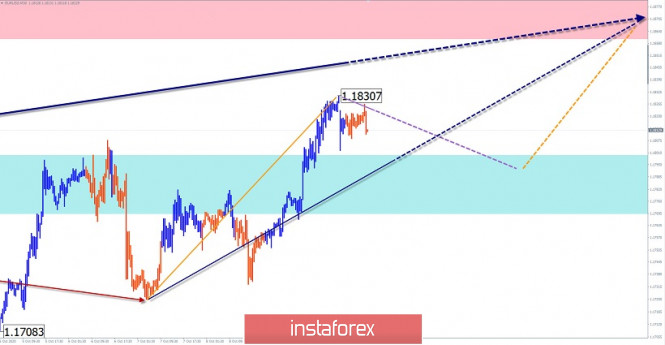
The wave level of the upward wave that started in March is very close to the weekly scale of the chart. All oncoming traffic only corrects the main momentum. The last section on the trend has been reporting since September 25. The wave is approaching the lower boundary of the preliminary target zone.
Forecast:
The pair's upward movement is expected to continue in the next 24 hours. At the European session, a short-term decline in the area of the support zone is possible. The calculated resistance is located at the lower border of the potential reversal zone of a large TF.
Potential reversal zones
Resistance:
- 1.1860/1.1890
Support:
- 1.1800/1.1770
Recommendations:
There are no market conditions for selling euros today. We recommend buying the pair in the area of settlement support. The lifting potential is limited by the resistance zone.

AUD/USD
Analysis:
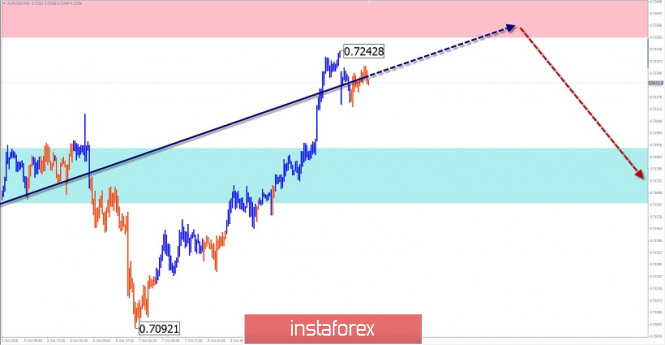
the Australian dollar chart is dominated by an upward trend. The unfinished section counts down from September 25. The price has reached the borders of the potential reversal zone. Without working out oncoming traffic, a further price rise is unlikely.
Forecast:
Today, the price is expected to move in the corridor between the nearest counter zones. An upward vector is more likely in the upcoming session. The exchange rate change and price decline can be expected by the end of the day or tomorrow.
Potential reversal zones
Resistance:
- 0.7250/0.7280
Support:
- 0.7190/0.7160
Recommendations:
Trading on the pair's market today is only possible with a reduced lot within the intraday. Before the emergence of a clear reversal signal, purchases are more secure.

GBP/JPY
Analysis:
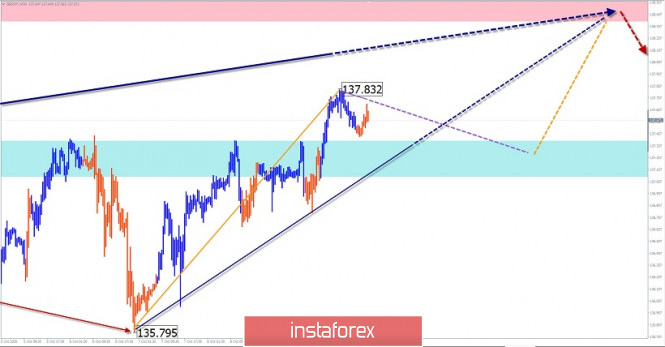
On the pair's chart, the bearish wave from June 5 is not completed by the current day. Within its last section from September 1, an upward correction has been formed in the last 3 weeks. The price is approaching the lower limit of the preliminary target zone.
Forecast:
The general upward trend is expected to continue today, with the price moving towards the calculated resistance. It is located at the upper edge of the potential reversal zone. At this level, you can expect a change of course and the beginning of a decline.
Potential reversal zones
Resistance:
- 138.40/138.70
Support:
- 137.40/137.10
Recommendations:
Trading on the pair's market today is only possible within the intra-session style. There are no suitable conditions for sale yet. It is better to reduce the trading lot in transactions.

Explanation: In the simplified wave analysis (UVA), waves consist of 3 parts (A-B-C). The last incomplete wave is analyzed. The solid background of the arrows shows the formed structure, and the dotted background shows the expected movements.
Note: The wave algorithm does not take into account the duration of the instrument's movements in time!
The material has been provided by InstaForex Company - www.instaforex.com


 Download NOW!
No comments:
Post a Comment