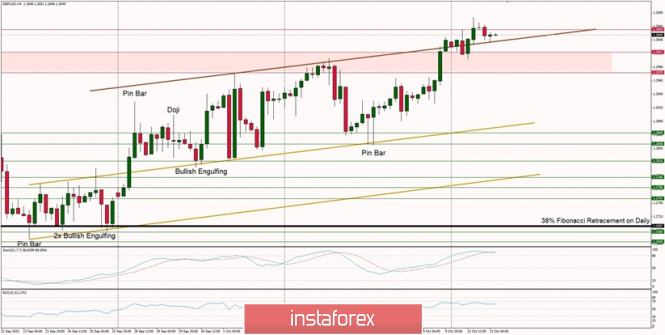
Technical Market Outlook:
The GBP/USD pair has broken out of the channel zone and now is trading around the technical resistance located at the level of 1.3059. The local high was made at the level of 1.3081. If the momentum still be strong and positive, the next target for bulls is seen at the level of 1.3121 and 1.3169. The nearest intraday support is located at the level of 1.3006. There is no sign of up trend reversal at the H4 time frame chart yet, but please notice the market conditions are starting to become overbought.
Weekly Pivot Points:
WR3 - 1.3328
WR2 - 1.3191
WR1 - 1.3137
Weekly Pivot - 1.2992
WS1 - 1.2933
WS2 - 1.2792
WS3 - 1.2730
Trading Recommendations:
On the GBP/USD pair the main, multi-year trend is down, which can be confirmed by the down candles on the monthly time frame chart. The key long-term technical resistance is still seen at the level of 1.3518. Only if one of these levels is clearly violated, the main trend might reverse (1.3518 is the reversal level) or accelerate towards the key long-term technical support is seen at the level of 1.1903 (1.2589 is the key technical support for this scenario).


 Download NOW!
No comments:
Post a Comment