EUR/USD - 24H.

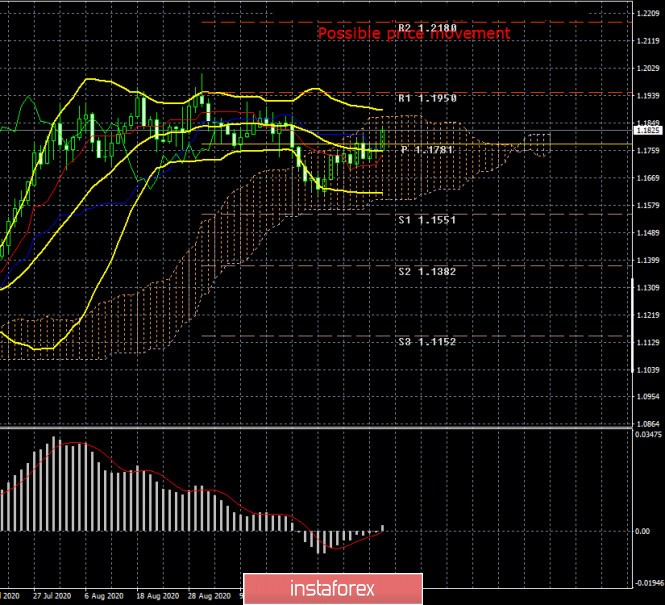
As we have said many times in our daily articles, the euro/dollar pair has been trading mostly sideways in recent weeks and even months. There is no pronounced side channel at this time, however, the sideways movement itself is visible on the 24-hour timeframe. Previously, traders had a side channel of $ 1.17 - $ 1.19 at their disposal, however, now its borders are more blurred. The pair is trading approximately between 1.1620 and 1.1940. That is, the channel width is 320 points. The Bollinger bands are also mostly directed sideways, which is another proof of the lack of a trend at this time. Thus, it is very inconvenient to trade the pair on higher timeframes, i.e. in the long term. We'll talk about the reasons for the flat a little later.
The COT report.

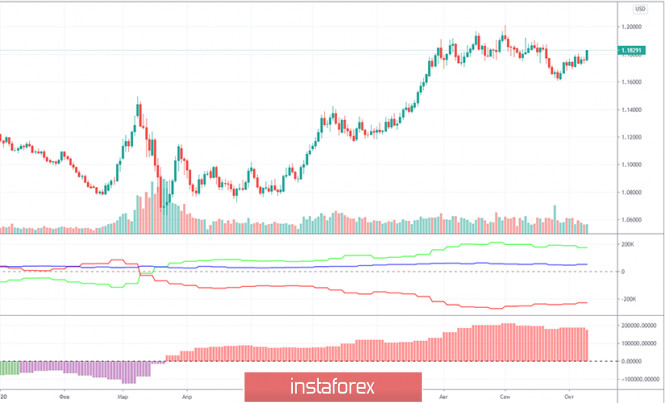
During the last reporting week (September 29 - October 5), the EUR/USD pair rose by about 120 points. But in general, as we have already discussed above, there have been no major price changes for the pair in recent months. Thus, data from any COT report can only be used for long-term forecasting. A new COT report showed that non-profit traders, which are the most important group of traders in the foreign exchange market, closed 10,784 buy contracts and opened 2,078 sell contracts. Recall that two weeks earlier, the "Non-commercial" group relatively actively increased its long positions, but now, for the second week in a row, it is reducing its net position. This may indicate that the upward trend for the pair is complete. Or nearing its end. We have already mentioned that the net position lines of the "Commercial" and "Non-commercial" groups (the upper indicator, green and red lines) diverge greatly when a trend change occurs. If this is the case this time, the peak point of the upward trend will remain $ 1.20. It was at this point that the net position of non-commercial traders was maximum. After reaching this level, it falls steadily. Thus, the pair may try to perform another upward dash, like the final assault of the bulls, however, it is unlikely to expect a pair much higher than the 20th figure.
Last week, Christine Lagarde and Jerome Powell spoke very often. So often that traders now have no doubts about what to expect from American and European regulators. Unfortunately, all this information passed the market. As well as 90% of macroeconomic statistics. Yes, we now clearly know that the US economy requires a new stimulus package to continue the recovery at the same pace. And negotiations on this package failed between Democrats and Republicans. In Europe, the second wave of "coronavirus" is feared. However, for the EUR/USD pair, the most important factor right now is political. Namely, the US presidential election. The economic situation in the Eurozone remains more stable than in the US, however, this factor has long been played back by traders (the euro has risen by 13 cents since April). Thus, to further strengthen the European currency, we need a new negative from overseas or a new positive from the EU. There are obvious problems with both now. Traders are simply afraid to buy the US currency three weeks before the election. As we have noted many times, there is no worse state for markets than a state of uncertainty. A change of government is always an uncertainty. Thus, we believe that the US dollar will not be able to show growth for at least another three weeks. Further, everything will depend on how smoothly and calmly the US elections will be held.
Trading plan for the week of October 12-16:
1) Taking into account the fact that in the long term we observe the movement as close as possible to the definition of "flat", it is recommended to trade using small timeframes, hourly and 4-hour. At this time, the euro is growing and may well reach 1.1900. The further upward movement is questionable. Therefore, as long as the Ichimoku indicator and the graphical patterns (channels, trend lines) that we use every day to build trading strategies in our articles support the upward movement, we recommend buying the pair.
2) To resume selling the EUR/USD pair, we recommend waiting for the price to consolidate below the Kijun-sen line. There is no clear trend on the hourly and 4-hour charts, thus, we rely on the main lines of the Ichimoku indicator when making trading decisions. On the 24-hour timeframe, the lines of the Ichimoku indicator are currently formal, since they are not strong in the flat.
Explanation of the illustrations:
Price levels of support and resistance (resistance/support) – target levels when opening purchases or sales. You can place Take Profit levels near them.
Ichimoku indicators, Bollinger bands, MACD.
Support and resistance areas – areas that the price has repeatedly bounced from before.
Indicator 1 on the COT charts – shows the net position size of each category of traders.
Indicator 2 on the COT charts – the net position size for the "Non-commercial" group.
The material has been provided by InstaForex Company - www.instaforex.com


 Download NOW!
No comments:
Post a Comment