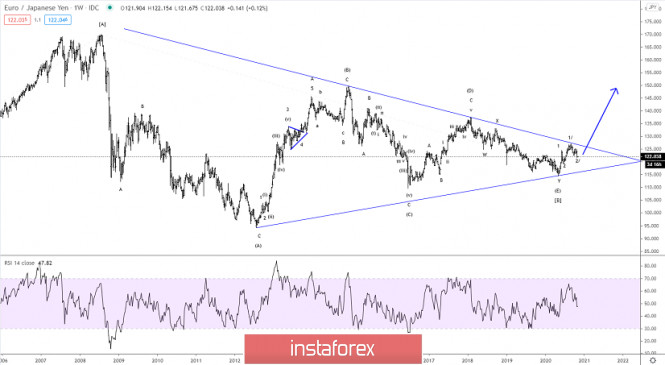
Without much action overnight, we think that it might be wise to take a step back and look at the larger picture. In April 2020 we concluded that wave (E) of the huge multi-year [B]-wave triangle bottom and a new long-term impulse rally in wave [C] has begun. We are still in the early days of this new impulsive [C] that ultimately should move above the peak of wave [A] at 169.97. To confirm this scenario the pair needs to break clearly above the triangle-resistance line near 127.07. A break above here calls for much more upside pressure with resistance at 137.50 as the first major target.
As long as the pair remains locked inside the triangle almost everything can happen as wave (E) can turn into a mini-triangle itself within the boundaries of the larger triangle. It is not our favorite count but at this point, it still cannot be excluded.
R3: 129.68
R2: 127.07
R1: 125.16
Pivot: 122.62
S1: 121.62
S2: 119.12
S3: 116.60
We are long EUR from 122.25 with our stop placed at 121.60
The material has been provided by InstaForex Company - www.instaforex.com


 Download NOW!
No comments:
Post a Comment