To open long positions on GBP/USD, you need:
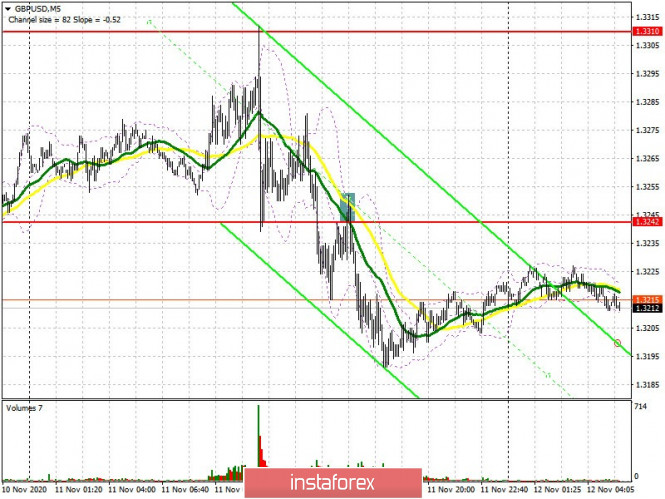
The British pound emerged from an excellent side yesterday, allowing both buyers and sellers to earn money. There was a great long entry point in the morning, which I discussed in detail in yesterday's review. The bears' unsuccessful sluggish attempt to regain the market below 1.3261 led to another false breakout, which only confirmed the preservation of the bull market at the beginning of the European session. The large rally towards the 1.3315 high was not surprising, afterwards the bulls began to take profit. The currency was under pressure in the afternoon. I advised you to open short positions only when the pair has settled below support at 1.3242, which is what happened. On the chart, you can see the bears going below 1.2342 and then testing that same level from the bottom up, forming an excellent entry point for short positions that generated over 60 points of profit.

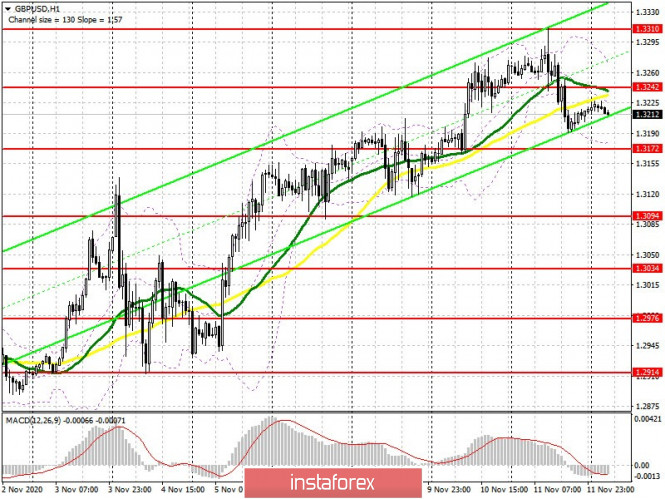
Buyers should return resistance at 1.3248, since the pair's long term direction depends on this level. However, this can only be done in case we receive good data on the UK economy for the third quarter. A breakout and settling above 1.3248 as well as testing this level from top to bottom produces an excellent entry point into long positions, which will open a direct road to the weekly high of 1.3310. Bank of England Governor Andrew Bailey could provide support to the pound, which will lead to a breakdown of 1.3310 and growth to a high of 1.3378, where I recommend taking profit. In case GBP/USD falls in the first half of the day after receiving weak data, it is best not to rush into long deals, but instead you should wait for a false breakout to form in the support area of 1.3172. Lack of bullish activity in this range could pull down the pound. Therefore, I recommend opening long positions immediately on a rebound from support at 1.3094, counting on a correction of 30-40 points within the day.
To open short positions on GBP/USD, you need:
Pound sellers will aim to protect resistance at 1.3248, which may be tested today after the release of a number of fundamental data on the UK economy. If they manage to form a false breakout at this level, this will be another signal to open short positions further along the trend. A breakout and settling below support at 1.3172 is also an important task for maintaining the downward momentum. This will increase the pressure on the pair and pull down GBP/USD to a low of 1.3094, where I recommend taking profits. Do not rush to open short positions in case bears are not active at the 1.3248 level. It is best to wait until the weekly high of 1.3310 has been updated and a false breakout is formed there, or to sell GBP/USD immediately on a rebound from resistance at 1.3378, counting on a correction of 30-40 points within the day.

The Commitment of Traders (COT) report for November 3 showed a reduction in long positions and a slight increase in short ones. Long non-commercial positions fell from 31,799 to 27,701. At the same time, short non-profit positions only rose to 38,928, from 38,459. As a result, the negative non-commercial net position was 11,227, against 6,660 a week earlier, which indicates that sellers of the British pound remain in control and have a minimal advantage in the current situation.
Indicator signals:
Moving averages
Trading is carried out just below the 30 and 50 moving averages, which indicates the likelihood of the continued downward correction.
Note: The period and prices of moving averages are considered by the author on the H1 hourly chart and differs from the general definition of the classic daily moving averages on the daily D1 chart.
Bollinger Bands
The breakout of the upper border in the 1.3254 area will lead to a new wave of growth for the pound. A break of the lower border of the indicator around 1.3172 will increase the pressure on the pound.
Description of indicators
- Moving average (moving average, determines the current trend by smoothing out volatility and noise). Period 50. It is marked in yellow on the chart.
- Moving average (moving average, determines the current trend by smoothing out volatility and noise). Period 30. It is marked in green on the chart.
- MACD indicator (Moving Average Convergence/Divergence — convergence/divergence of moving averages) Quick EMA period 12. Slow EMA period to 26. SMA period 9
- Bollinger Bands (Bollinger Bands). Period 20
- Non-commercial speculative traders, such as individual traders, hedge funds, and large institutions that use the futures market for speculative purposes and meet certain requirements.
- Long non-commercial positions represent the total long open position of non-commercial traders.
- Short non-commercial positions represent the total short open position of non-commercial traders.
- Total non-commercial net position is the difference between short and long positions of non-commercial traders.


 Download NOW!
No comments:
Post a Comment