If we look at how the issue of the US presidential election unfolds, we can say that everything is chaotic. The official results have not yet been announced, one of the contenders claims numerous violations, while the supporters of the Democratic party have already lined up to pledge their respect to the new US president. However, the legalization of falsifications is in full swing and, apparently, Joe Biden can be safely called not elected, but appointed as the President of the United States. Nonetheless, we will not talk about elections, but about the consequences of elections for financial markets, and practically from the point of view of intermarket ties.
The end of the US presidential election that emits the dollar, and the appointment of Joe Biden as President, brought significant relief to the markets. As soon as it became clear that the Democratic leader will be able to take the White House, stock indexes around the world began to recover their lost positions, and on Monday, the SP500 stock index updated its historical high due to the news of the imminent start of registration and production of the Covid-19 vaccine by Pfizer. However, we could not hold on to the reached values, and there is almost no trace of the former growth.
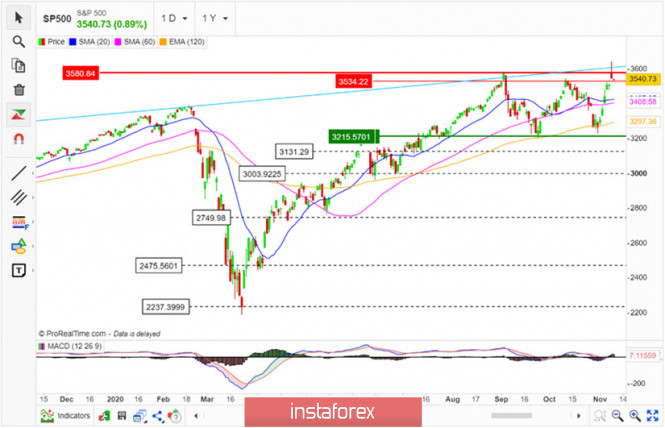
Yesterday, the S&P 500 #SPX index failed to make an attempt to consolidate above the level of 3580, and there is a high possibility that it will return to the 3200 - 3500 range (Fig. 1) within the next one to two weeks. At the same time, it is early to draw any thoughtful conclusions about what will happen on the stock market for the time remaining until the new year. The final results have not yet been calculated, and the pandemic is still not going away.

Fig. 1: Technical picture of the S&P 500 index on November 10
Even if Biden's victory is officially recognized, Republicans are waiting for him in the Senate, who will neglect his initiatives and bills in every possible way. Therefore, we should at least wait until the current week closes before we can draw preliminary conclusions. However, it is also early to talk about a false breakdown of the SP500 stock index up, against the background of the end of the US elections, because a false breakdown can easily become true again. We can't manage time, which means we just need to wait and consider different options without giving preference to any of them, reacting and not opening deals in accordance with our visions.
A similar picture has now emerged for many assets. The European currency in the EUR/USD pair remains in the range and continues to confuse traders with false breakdowns in both directions. The long-term, medium-term and short-term trends are directed upwards, and the range is a continuation trend pattern, but this is the euro, which means we should consider the range as a figure of uncertainty, with an equally probable rate exit in both directions.
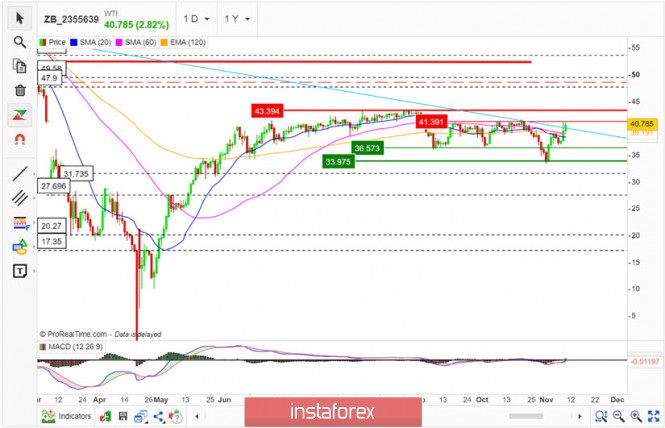
On the other hand, the price of oil also interests traders. In both reference varieties - WTI and Brent, the bullish reversal pattern has not yet been fully formed. However, it can be argued with some caution that two of the three conditions necessary for classifying the oil drop that occurred last week as a false breakout have already been formed (Fig. 2). This gives us some hope, but nothing more.

Figure 2: Technical picture of WTI #CL oil on November 10
Analyzing carefully the situation in Figure 2, we can see that #CL oil was in the range of $ 36.57- $ 41.39 from September to October. However, it declined to $ 33.97 in early November, but then returned to the above range and rose above its midpoint. Now, in order for oil to continue its increase, and its decline to the level of $33.97 can be classified as a false breakdown, the WTI brand needs to be fixed at the level of $41.40, or even better, $43.40. After the price is consolidated above these values, it will be safe to say that oil has changed its direction from a decrease to an increase and look at the purchases of oil and energy companies. But it is still early to do this at the moment.
According to the Traders Obligations Report (COT), the situation on the oil market is not as good as we would like to see. The fact is that at the time when #CL oil was testing level 34, the long positions of money manager speculators were reduced to six month lows, and their short positions, on the contrary, rose to the level of April. This is a very bad indicator from the point of view of oil price recovery. It is quite possible that the rapid growth in oil prices that we have seen over the past few days has led to the closing of sales deals opened by speculators, but we will only find out about this when a new report is published. So far, there is no no reason to accept this possibility as a fact.
The material has been provided by InstaForex Company - www.instaforex.com


 Download NOW!
No comments:
Post a Comment