GBP/USD
Analysis:
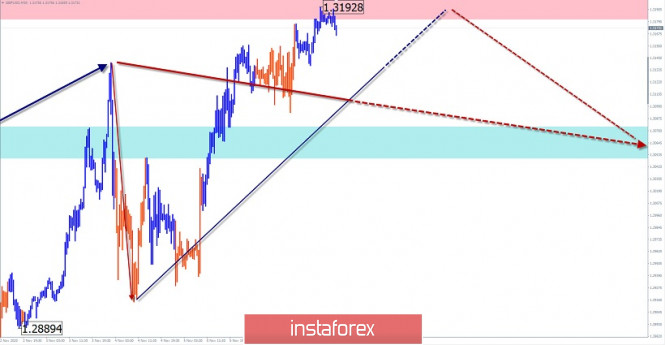
For intraday supporters, the trend direction is set by the rising wave from September 10. Since October 21, a corrective zigzag is formed. Over the past week, it has been developing an intermediate pullback (B). Despite the active rise of the exchange rate in recent days, the structure of the downward correction is not broken. Quotes have reached the lower limit of a strong resistance zone.
Forecast:
In the next 24 hours, after a likely attempt to put pressure on the resistance, the price is expected to turn and decrease to the support area. When changing the course, there may be a short-term puncture of the upper boundary of the settlement zone.
Potential reversal zones
Resistance:
- 1.3180/1.3210
Support:
- 1.3080/1.3050
Recommendations:
There are no conditions for purchases in the pound market today. It is recommended to track emerging signals for selling the instrument.

USD/JPY
Analysis:
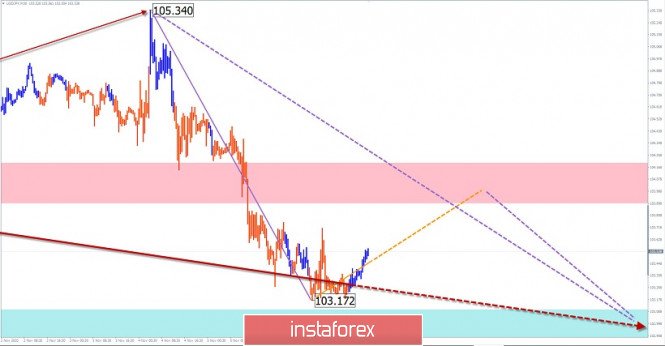
A downward trend has been developing on the Japanese yen chart Since March this year. The last wave in the main direction started on October 8. From November 4, the final part (C) is formed. The price of the pair has reached the upper limit of a strong potential reversal zone.
Forecast:
In the upcoming trading sessions, the general flat mood of the movement is expected. In the first half of the day, an upward rate is more likely, up to the calculated resistance. A second decline can be expected at the end of the day or tomorrow.
Potential reversal zones
Resistance:
- 103.90/104.20
Support:
- 103.10/102.80
Recommendations:
Trading the yen today is only possible within the intraday. Purchases have little upside potential and can be risky. Sales from the resistance zone are safer.

Explanation: In the simplified wave analysis (UVA), waves consist of 3 parts (A-B-C). The last incomplete wave is analyzed. The solid background of the arrows shows the formed structure, and the dotted one shows the expected movements.
Note: The wave algorithm does not take into account the duration of the instrument's movements in time!
The material has been provided by InstaForex Company - www.instaforex.com


 Download NOW!
No comments:
Post a Comment