EUR/USD 24H

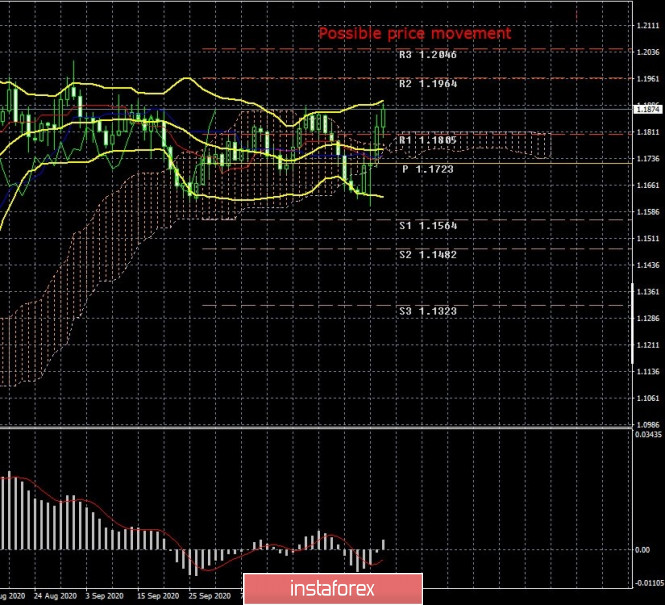
The EUR/USD pair rose by 220 points over the past week. However, such a strong growth does not mean that an upward trend would form. Recall that the EUR/USD pair was trading mainly within the horizontal channel of $1.17-1.19 or its equivalent 1.1640-1.1920 for the last three months. One way or another, a flat was kept all this time. The bulls did not want it, and the bears had no reason. However, the US presidential election marked the previous trading week. And, we believe that the dollar's fall was quite justified, since the whole election process falls under the meaning of the word chaos. And so the pair came close to the top line of the first side band (and the second one too). A price rebound from the 1.1900-1.1920 area may trigger a downward movement. At least now it is impossible to conclude that the lateral trend is over. As we warned, sellers failed to show their persistence on the way to the 1.1612 level (the previous local low).
COT report

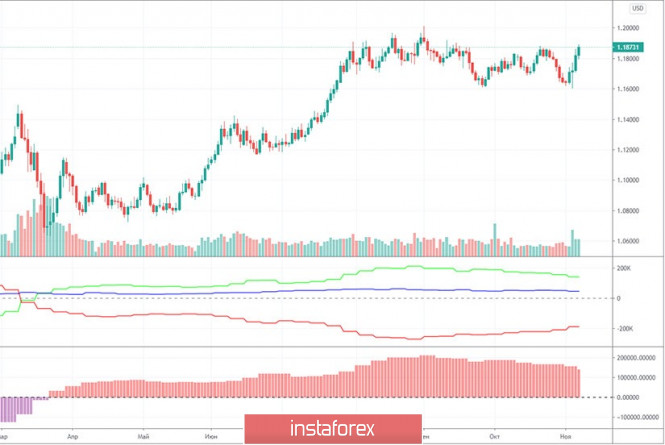
The EUR/USD pair dropped 170 points last reporting week (October 27-November 2). A strong upward movement began after this time range. Therefore, the fact that the pair grew by 220 points simply does not fall within the time frame of the latest Commercial of Traders (COT) report. According to it, professional traders closed 9,200 Buy-contracts (longs) and opened 7,800 Sell-contracts (shorts). And so the net position for non-commercial traders suddenly decreased by 17,000. And any decrease in the net position is a strengthening of the bearish mood. Consequently, professional traders continue to look towards shorts on the euro. Therefore, even despite the euro's subsequent growth, we continue to believe that the high near the 1.2000 level will stay as the peak of the entire uptrend. At least the COT data continues to signal just that. Technical analysis may contradict the COT report, as the latter comes out with a three-day delay. There is no way to know how the major players behaved in the period from November 3 to 6, when the US dollar was greatly falling in value due to the elections. Indicators are also signaling good prospects for a new downward trend now, as the green and red lines continue to narrow (the first indicator). And they, we recall, reflect the net positions of non-commercial traders and commercial ones.
What can you say about the fundamental background of the last trading week? By and large, markets were focused on the US elections. First, to the voting (up to November 3 inclusive), then to the interactive counting of votes, then to the comments of Donald Trump and Joe Biden. Donald Trump, in his style, declared himself the winner back on November 4, when even the intermediate results were not accurate. Naturally, later, when Biden's victory began to take on a clearer form, Trump began to implement his strategy, which is to misinform the media and accuse Democrats of falsifying election results. Actually, now everything is going to the trial. Trump has already filed lawsuits in the courts of several states. Somewhere the incumbent president pointed to the exclusion of representatives of the Republican Party from polling stations, called to stop the counting of votes, and made accusations of falsification. Thus, these lawsuits will have to be considered by the courts, and Trump himself has long made it clear that he will not admit his defeat in the elections. Against the backdrop of all this political chaos and the possible further confrontation between Democrats and Republicans, the US dollar depreciated over the past week. Traders did not pay any attention to the Federal Reserve meeting, to Friday's macroeconomic statistics on NonFarm Payrolls and unemployment (which, by the way, could and should have supported the dollar). And as long as political uncertainty persists, the US dollar will remain under market pressure. Which even somewhat contradicts the conclusions drawn from the COT report. Therefore, we, as before, recommend looking for technical confirmation of hypotheses made on the basis of the foundation and COT.
Trading plan for November 9-13:
1) The pair's quotes quickly returned to the horizontal channel. Quotes settled above all the key lines of the Ichimoku indicator, which, however, in a flat, only generates false signals. Thus, so far we can only state a flat. We can only talk about returning the upward trend when the previous local high near the 1.2000 level has been overcome. You should be very careful when trading up on the 4-hour timeframe.
2) In order to be able to sell the EUR/USD pair, you must at least wait for the price to settle below the Kijun-sen and Senkou Span B lines. However, even in this case, it is far from certain that the flat will end. Thus, you can look for short-term trends on lower timeframes, but take note that a flat will be present in the long term
Explanations for illustrations:
Support and Resistance Levels are the levels that serve as targets when buying or selling the pair. You can place Take Profit near these levels.
Indicators Ichimoku, Bollinger Bands, MACD.
Support and resistance areas are areas from which the price has repeatedly rebounded off.
Indicator 1 on the COT charts is the size of the net position of each category of traders.
Indicator 2 on the COT charts is the size of the net position for the "non-commercial" group.
The material has been provided by InstaForex Company - www.instaforex.com


 Download NOW!
No comments:
Post a Comment