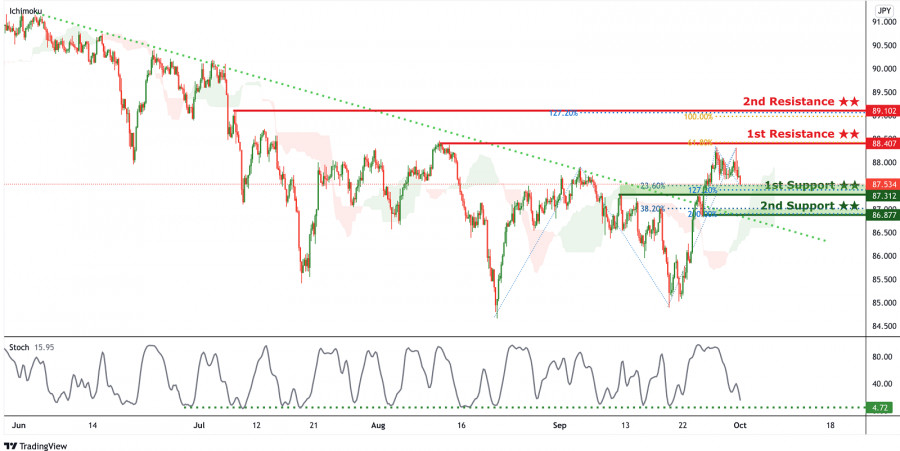
Price broke out of the descending trendline resistance (now support) signifying a bullish momentum. Price is approaching the area of 1st support in line with 23.6% Fibonacci retracement, 127.2 % Fibonacci Projection and graphical overlap, we can expect price to bounce from the 1st support area to 1st Resistance in line with 61.8% Fibonacci Projection. Our bullish bias is further supported by the Ichimoku cloud where price holding above it showing a support level and the stochastic indicator where the %D line is approaching the support level awaiting for a bounce.
Trading Recommendation
Entry: 87.312
Reason for Entry:
23.6% Fibonacci retracement, 127.2 % Fibonacci Projection and graphical support,
Take Profit: 88.407
Reason for Take Profit:
61.8% Fibonacci Projection, previous swing high
Stop Loss: 86.877
Reason for Stop Loss:
38.2% Fibonacci retracement ,200% Fibonacci Projection
The material has been provided by InstaForex Company - www.instaforex.comfrom RobotFX


 Download NOW!
No comments:
Post a Comment