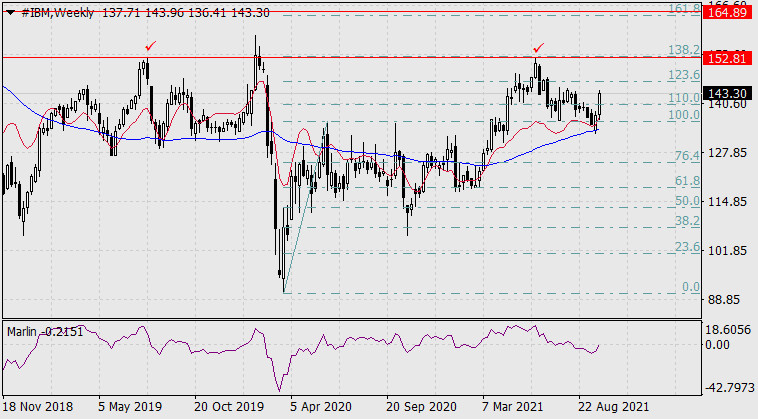
Purchasing shares of International Business Machines Corporation (#IBM), the largest manufacturer of computer components.
According to the weekly chart, the price reversed from the support of the Kruzenshtern Indicator line, creating a new upward-trending impulse wave.

The Marlin Oscillator is approaching the zero line, the border with the growth territory. The price is likely to advance to the level of the highs posted in June 2021 and July 2019, which is almost in line with the 138.2% Fibonacci level. If the price overcomes this level, it may well rise to the level of 164.89, that is, the high of August 2016, located just above the 161.8% Fibonacci level.

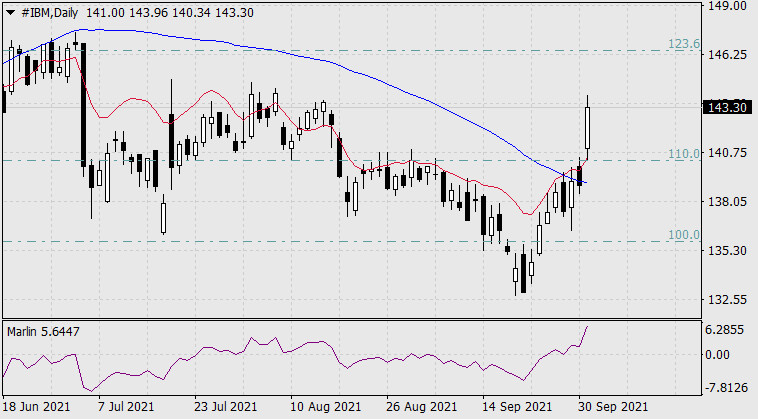
According to the daily chart, the price consolidated above the balance line, the Kruzenshtern Indicator line, and the 110.0% Fibonacci level. Therefore, its further growth is highly likely.
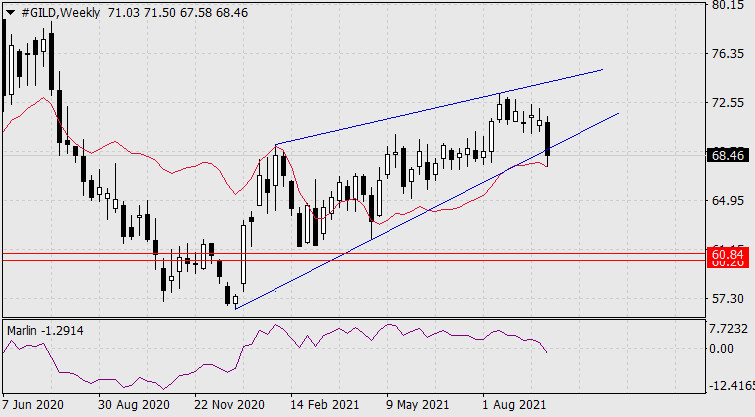
The sale of Gilead Sciences stock (#GILD), a US biotech company.
According to the weekly chart, the price broke out of the wedge-shaped pattern downwards, and the Marlin Oscillator crossed the border with the downtrend territory. Thus, the price is expected to continue its bearish run towards the target range of 60.26-84 limited by the lows of September 2019 and December 2018.

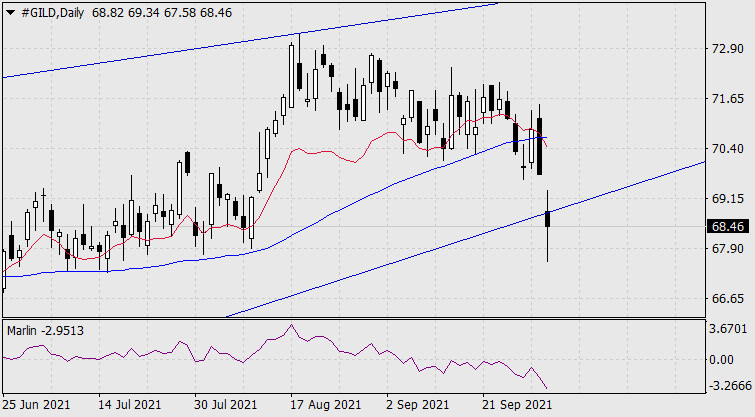
According to the daily chart, the price fixed below the indicator lines. The Marlin oscillator is diving deeper into the territory of bears.

from RobotFX


 Download NOW!
No comments:
Post a Comment