
Cardano is trading below $2 after breaking below the short-term triangle pattern. A bearish signal has been given on Wednesday, while price is consolidating near recent lows. Short-term trend is bearish and price is vulnerable to more downside.
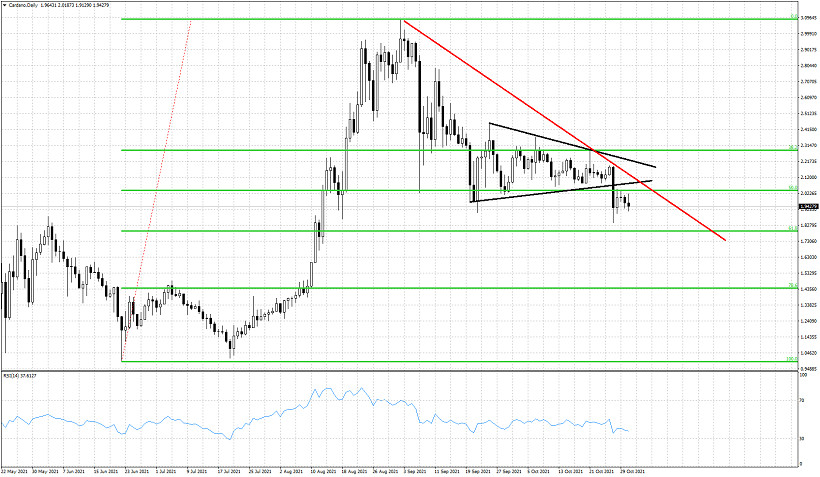
Green lines - FIbonacci retracement levels
Black lines- triangle pattern
Cardano is making lower lows and lower highs. Cardano has resistance at $2.13 at the red downward sloping resistance trend line. As long as price is below the red resistance trend line, Cardano is vulnerable to a move lower towards $1.79. Next target below $1.79 is at $1.44.
The material has been provided by InstaForex Company - www.instaforex.comfrom RobotFX


 Download NOW!
No comments:
Post a Comment