EUR/USD 5M

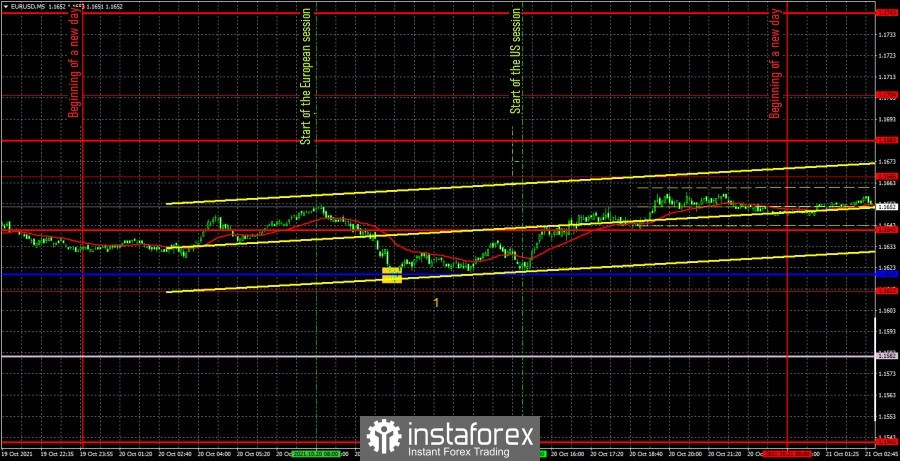
The EUR/USD pair continued to move in its usual style on Wednesday. Namely, the absence of a trend and weak volatility. Volatility amounted to 36 points on Wednesday, which is even less than "little". However, traders should have already gotten used to such "movements" of the pair, as they have been going on for several months. Oddly enough, but today there was even macroeconomic statistics. That is, the markets had something to react to during the day. Another thing is that they did not consider it necessary to do this. The report on European inflation for September turned out to be as uninteresting as possible, since the actual value (3.4%) coincided with both the previous and the forecast. Thus, no special conclusions can be drawn after this report. The chart clearly shows that nothing has changed since the publication of this report (the number "1" in the chart). Now let's move on to trading signals. It, in principle, was formed only on Wednesday. But what! A vivid example of what is called a strong signal. We draw your attention to the fact that the Kijun-sen line increased during the day, which is clearly visible on the 4-hour timeframe, from where it is carried over every day. And it is precisely because of this that a buy signal was formed. After its formation, the price overcame the resistance level of 1.1641 without rebounding from it, so there was no reason to close long positions. It was possible to manually close the long position at a profit of about 25 points in the evening, when the price did not form a sell signal. Excellent result!
EUR/USD 1H

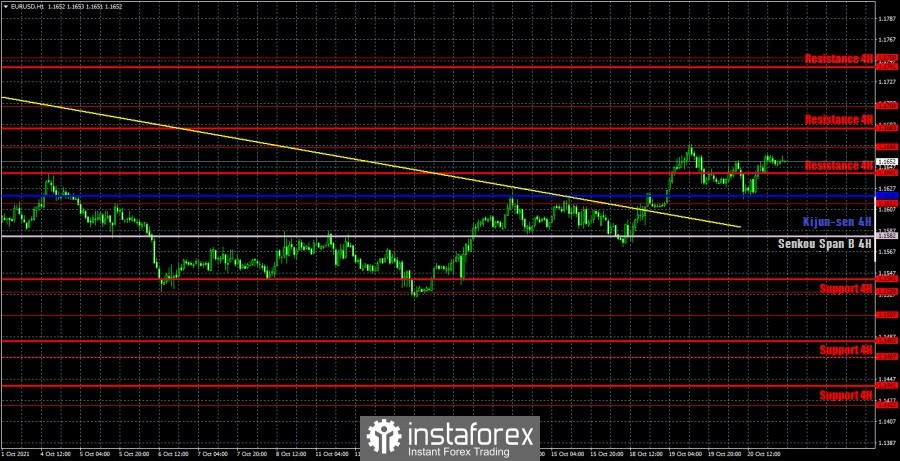
You can see how the euro/dollar pair has corrected to the critical line and at the same time maintained the current upward trend on the hourly timeframe, Thus, we have the right to expect the continuation of the movement to the North, which is still very difficult to explain from the point of view of fundamental analysis. We see that most of the macroeconomic statistics are simply ignored by the markets, and the fundamental topics that exist now do not have any impact on the markets. The only thing that can be noted is that the markets may continue to get rid of the dollar amid weakening confidence that the Fed will announce the start of the QE program in November. On Thursday, we highlight the following levels for trading - 1.1612, 1.1666 and 1.1704, as well as the Senkou Span B (1.1582) and Kijun-sen (1.1620) lines. The Ichimoku indicator lines can change their position during the day, which should be taken into account when looking for trading signals. Signals can be rebounds or breakthroughs of these levels and lines. Do not forget about placing a Stop Loss order at breakeven if the price moves 15 points in the right direction. This will protect you against possible losses if the signal turns out to be false. The calendars of macroeconomic events in the European Union and the States will be empty again on October 21. In theory, one could look at the report on the number of initial and repeated claims for unemployment benefits, but the likelihood that the markets will work it out is negligible. Thus, it looks like another day with minimal volatility awaits us.
We recommend you to familiarize yourself:
Forecast and trading signals for GBP/USD for October 21. Detailed analysis of the movement of the pair and trade deals.
Analysis of the COT report

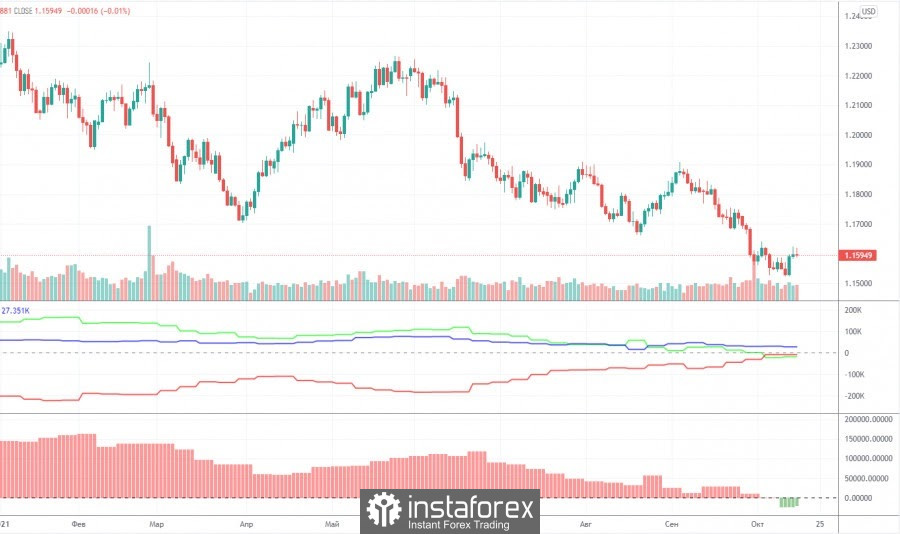
The mood of non-commercial traders practically did not change during the last reporting week (October 5-11). It even became a little less bearish. But all the same, it is already bearish, since for the first time in a long time the total number of open short positions for the "non-commercial" group exceeds the total number of open buy contracts (222,000 versus 203,000). During the reporting week, professional traders opened 5,700 buy contracts (longs) and 2,400 sell contracts (shorts). Thus, the net position increased by 3,300 contracts, but such a change is considered negligible for the general picture of things. We draw attention to another fact. At the beginning of this year, the net position of big players exceeded 150,000, and since then the European currency has fallen in price by only 6 cents, and the net position has lost about 170,000 contracts. We believe that the European currency has depreciated too weakly, given the changes in the data on contracts from professional players. We also draw attention to the fact that the euro is falling very weakly. As we have calculated more than once, by about 15 points a day. Every day, but the volatility still remains very weak. The weak volatility makes you doubt everything that is happening now with the pair. The US dollar still does not look like a currency that may show a strong trend in the near future. But, nevertheless, it continues to grow for more than a month. As a result, the Commitment of Traders (COT) reports now show a very likely continuation of the euro's decline. But we also recommend correlating these findings with the current technical picture.
Explanations for the chart:
Support and Resistance Levels are the levels that serve as targets when buying or selling the pair. You can place Take Profit near these levels.
Kijun-sen and Senkou Span B lines are lines of the Ichimoku indicator transferred to the hourly timeframe from the 4-hour one.
Support and resistance areas are areas from which the price has repeatedly rebounded off.
Yellow lines are trend lines, trend channels and any other technical patterns.
Indicator 1 on the COT charts is the size of the net position of each category of traders.
Indicator 2 on the COT charts is the size of the net position for the non-commercial group.
The material has been provided by InstaForex Company - www.instaforex.comfrom RobotFX


 Download NOW!
No comments:
Post a Comment