GBP/USD 5M

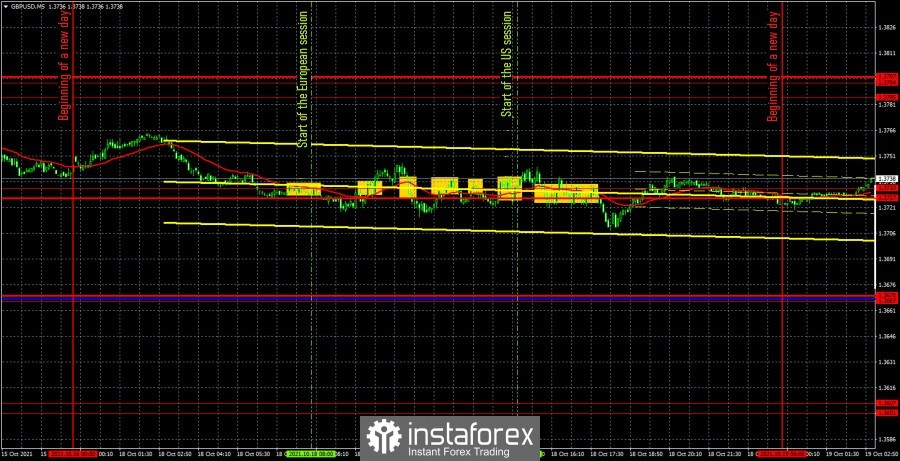
The GBP/USD pair traded even worse than the EUR/USD pair on October 18, which has recently been quite rare. But the fact remains. The pound/dollar pair spent most of the day in absolute flat. We didn't even highlight it in the chart above, because it is clearly visible. The quotes jumped around the extremum level of 1.3732 all day. They didn't even settle higher or lower or bounce off of it. They just didn't notice it. Naturally, in the conditions of an absolute flat with a volatility of 56 points, a huge number of signals were generated near the same level, and all of them turned out to be false, since there was no movement during the day. There were no macroeconomic reports on Monday. Fundamental events are similar. Thus, in such conditions, the main goal for traders was to minimize losses. In principle, only the first two signals should have been considered and rejected, since at that time it was not yet clear that the pair was in a tight flat. First, the price settled below the level of 1.3732 - a sell signal - a loss of 13 points, since in an hour the price settled above this level. And the second buy signal, which also canceled an hour later, as the pair went back below the 1.3732 level. The loss is another 13 points. Further, all subsequent signals should be ignored, since two false signals had already been formed near the level of 1.3732, which led to losses. In fact, this behavior of the pound/dollar pair was rather strange to see, since in recent weeks it has been moving more or less actively.
GBP/USD 1H

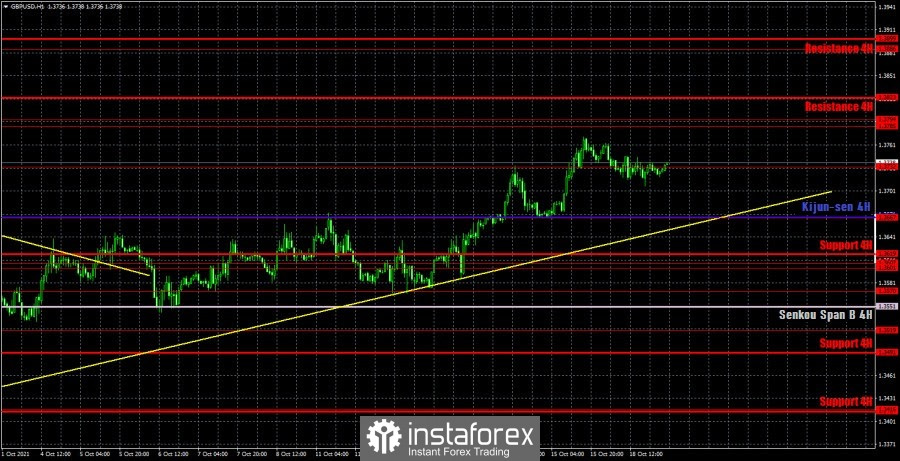
The pound/dollar pair maintains an upward trend on the hourly timeframe, as it continues to be located above the uptrend line. Once again, we draw attention to the fact that there is no correlation between the euro/dollar and pound/dollar pairs. Thus, the British currency may fall in the coming days to the critical line, around which the trend line passes. Breaking the trend line will signal the resumption of the downward movement. We distinguish the following important levels on October 19: 1.3601 - 1.3607, 1.3667, 1.3732, 1.3785 - 1.3794. Senkou Span B (1.3551) and Kijun-sen (1.3668) lines can also be sources of signals. It is recommended to set the Stop Loss level at breakeven when the price passes 20 points in the right direction. The Ichimoku indicator lines can move during the day, which should be taken into account when looking for trading signals. Neither the United States nor the UK is scheduled to report a single important or interesting report on Tuesday. The Governor of the Bank of England Andrew Bailey will make a speech in the UK, but he has already spoken this Sunday and again did not tell the markets anything interesting. Of course, you should not miss his speech, but the likelihood that it will provoke a serious movement of the British currency - 10-20 percent.
We recommend you to familiarize yourself:
Overview of the EUR/USD pair. October 19th. The euro is still standing still, but the markets are tired of the "Fed factor".
Review of the GBP/USD pair. October 19th. British paradox: falling unemployment with a persisting labor shortage.
Forecast and trading signals for EUR/USD for October 19. Detailed analysis of the movement of the pair and trade deals.
COT report

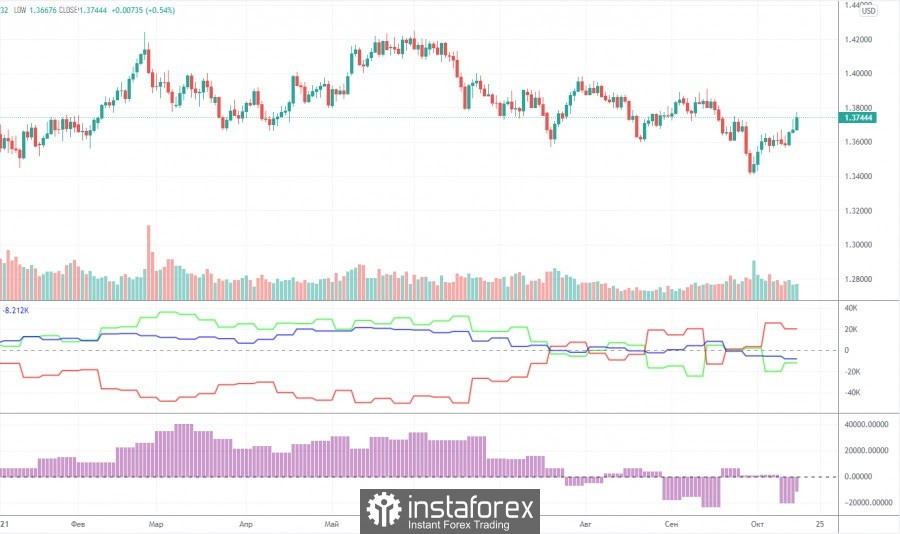
The mood of professional traders became less bearish again during the last reporting week (October 5-11). Major players closed 1,700 buy contracts (longs) and 10,600 sell contracts (shorts) during the week. Thus, the net position of professional traders has grown by almost 9,000, which is quite a lot for the pound. In principle, such a change in the mood of major players correlates well with how the pair moved during the same time period. The pound was growing, so it's reasonable to assume that the big players were buying it, not selling it. However, we are most interested in the general trend in COT reports. That is, how non-commercial traders behave over a long distance. And now let's look at the first indicator, especially at its movements over the past three months. The green and red lines (net positions of non-commercial and commercial traders) constantly change the direction of movement, cross each other, cross the zero mark. This suggests that there is no clear mood among the major players right now. It is constantly changing, which means there is no trend now. Moreover, if you look at the movements of the pair itself over the past 6-7 months, it is also clearly visible that the minimum downward trend is, of course, present, but still the quotes spent most of the time between the 36th level and the 42nd. That is, inside the horizontal channel. Thus, from our point of view, the Commitment of Traders (COT) reports now do not provide an opportunity to predict the pair's succeeding movement.
Explanations for the chart:
Support and Resistance Levels are the levels that serve as targets when buying or selling the pair. You can place Take Profit near these levels.
Kijun-sen and Senkou Span B lines are lines of the Ichimoku indicator transferred to the hourly timeframe from the 4-hour one.
Support and resistance areas are areas from which the price has repeatedly rebounded off.
Yellow lines are trend lines, trend channels and any other technical patterns.
Indicator 1 on the COT charts is the size of the net position of each category of traders.
Indicator 2 on the COT charts is the size of the net position for the non-commercial group.
The material has been provided by InstaForex Company - www.instaforex.comfrom RobotFX


 We introduce you to the daily updated section of Forex analytics where you will find reviews from forex experts, up-to-date monitoring of fi...


 Download NOW!
No comments:
Post a Comment