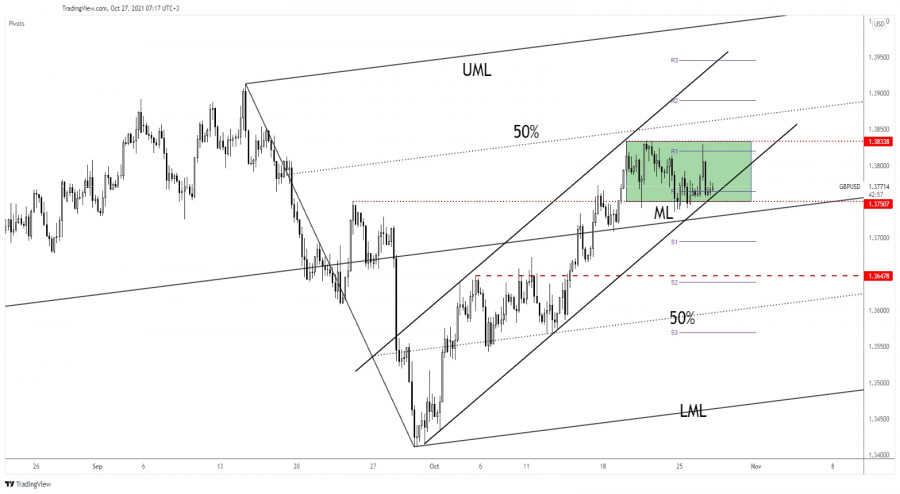
GBP/USD moves sideways in the short term after failing to make a new higher high. The price action has shown overbought signs as the Dollar Index has managed to make a new higher high yesterday.
Still, the bias remains bullish as the pair is located within an up channel. Personally, I'm waiting for confirmation around the support area before deciding to go long or short. Yesterday, the USD received a helping hand from the CB Consumer Confidence, Richmond Manufacturing Index, and from the New Home Sales indicators.
Today, the US Durable Goods Orders, Core Durable Goods Orders, Good Trae Balance, and the Prelim Wholesale Inventories could bring us a clear direction. Also, tomorrow, the Advance GDP could be decisive.
GBP/USD Range Pattern!

The GBP/USD pair is trapped between 1.3833 and 1.3750 levels and inside of an ascending channel. The bias is still bullish as long as the rate stands above the uptrend line. In the short term, the pressure is high after registering only a false breakout above the R1 (1.3820) and after failing to reach 1.3833 static resistance.
A valid breakdown below the uptrend line and a from the range pattern, below 1.3750 could announce that the upside is over and that GBP/USD could develop a downside movement.
GBP/USD Forecast!
As long as the GBP/USD pair stands above the uptrend line we can still look for new long opportunities. A false breakdown with great separation or a major bullish engulfing could announce a new leg higher.
Technically, an upside continuation will be activated by a valid breakout above 1.3833 static resistance.
The material has been provided by InstaForex Company - www.instaforex.comfrom RobotFX


 Download NOW!
No comments:
Post a Comment