4-hour timeframe

Technical details:
Higher linear regression channel: direction - downward.
Lower linear regression channel: direction - downward.
Moving average (20; smoothed) - sideways.
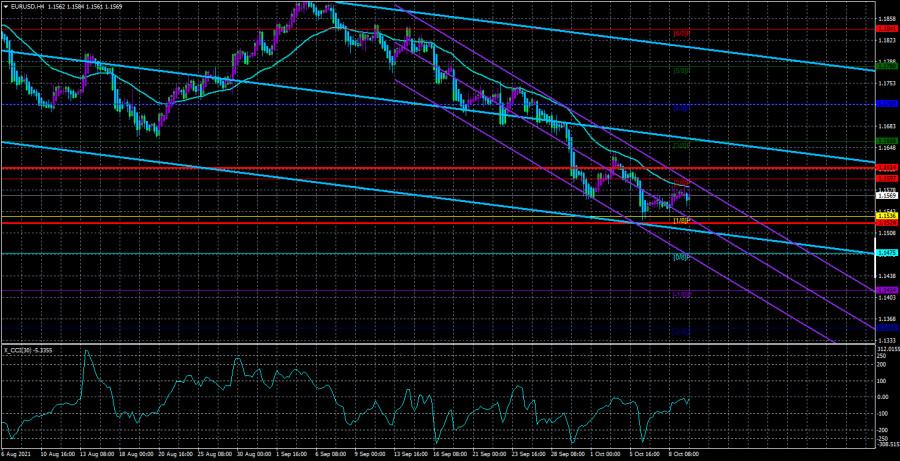
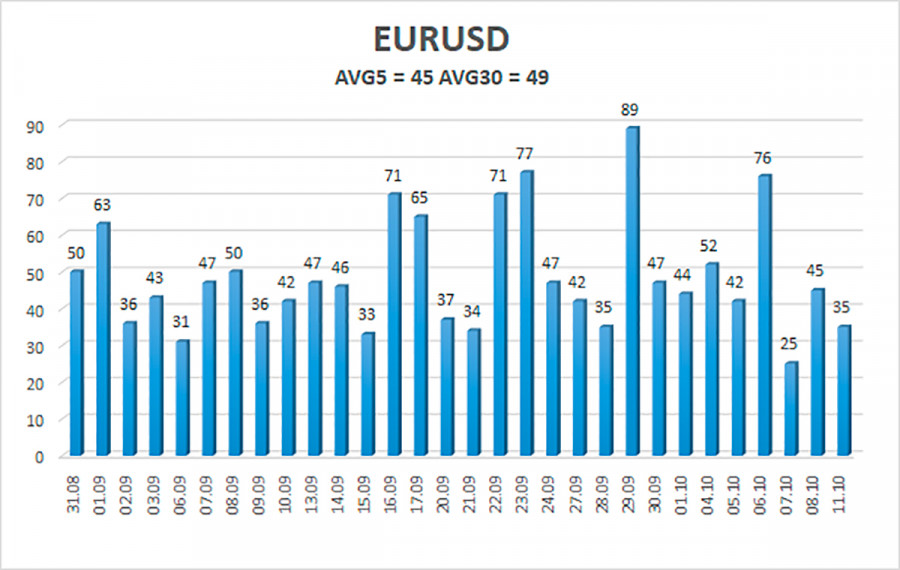
The EUR/USD currency pair started the new trading week calmly. The price continued to be located just below the moving average line, trying with all its might to correct or gain a foothold above the moving average. However, by and large, now it is not the price that is moving towards the moving average. The pair's volatility remains extremely weak, so it may take several days to overcome the moving average. Everything, as before, rests precisely on the volatility indicator. Last Friday was generally the apotheosis of market passivity in the last few months (recall that low volatility has been observed for three months, if not more, and the normal value of the indicator for the euro/dollar pair is 60-80 points per day). Nonfarm Payrolls reports, unemployment, and speeches by Joe Biden, Christine Lagarde, and Janet Yellen were ignored. The only thing that the markets have been vouchsafed to is the movement of 20 points up after the publication of Nonfarm. Thus, the overall technical picture now remains unchanged. The downward trend persists, the price continues to be located below the moving average, and both linear regression channels are directed downward. The fundamental background on Monday also did not change since there was no single important event either in the United States or in the European Union.
On Friday, as already mentioned, a speech by US President Joe Biden took place. In recent weeks, all the markets' attention has been focused on the issue of the US government debt limit, which was painfully increased by $ 480 billion at the end of last week. According to various estimates, this money will be enough to finance the state until December 3, 2021. In addition, the Lower House of Congress has not yet approved this decision of the Senate, as it is currently on vacation. However, the Speaker of the House of Representatives, Nancy Pelosi, promised to call members of Congress this week to approve the bill. Joe Biden, in his speech, criticized Republicans who block the increase in the limit. After all, $ 480 billion is a temporary measure to avoid a technical default already on October 18. However, in a month or a month and a half, it turns out that this issue will be reopened because the money in the Treasury accounts will run out again. As a result, US Treasury Secretary Janet Yellen has already criticized the very concept of the "debt limit" and stated that as long as this concept exists, the US economy will constantly be at risk. Biden also said that America always pays its debts. The measures he proposed (to raise the limit) aim to ensure that ordinary American families receive social benefits and wages. The US president also said that this money has nothing to do with his "infrastructure" package. It will not be used for any other expenses unrelated to social benefits and financing of state institutions to continue to function. Joe Biden also recalled that during the previous president's administration, Donald Trump (Republican), the same Republicans approved an increase in the debt limit, and now "they are not doing their job and do not allow the Democrats to do their own."
Thus, this issue was temporarily resolved, although it did not make it easier or harder for the US dollar. First, it continues to be in an upward trend. And it has been in it for more than a month. Second, the US currency ignored several important macroeconomic publications last week and a week earlier – several speeches by Christine Lagarde and Jerome Powell. Thus, now it is generally difficult to conclude that the US currency is reacting to something. If so, then the technical analysis is of paramount importance now.

The volatility of the euro/dollar currency pair as of October 12 is 45 points and is characterized as "low." Thus, we expect the pair to move today between the levels of 1.1524 and 1.1614. The reversal of the Heiken Ashi indicator downwards signals a possible resumption of the downward movement.
Nearest support levels:
S1 – 1.1536
S2 – 1.1475
S3 – 1.1414
Nearest resistance levels:
R1 – 1.1597
R2 – 1.1658
R3 – 1.1719
Trading recommendations:
The EUR/USD pair continues the round of corrective movement but fails to gain a foothold above the moving average. Thus, new sell orders should be opened today with targets of 1.1536 and 1.1524, as there was a rebound from the moving average line. Purchases of the pair should be opened if the price is fixed above the moving average with targets of 1.1614 and 1.1658. They should be kept open until the Heiken Ashi indicator turns down.
Explanations to the illustrations:
Linear regression channels - help determine the current trend. If both are directed in the same direction, then the trend is strong now.
Moving average line (settings 20.0, smoothed) - determines the short-term trend and the direction in which trading should be conducted.
Murray levels - target levels for movements and corrections.
Volatility levels (red lines) - the likely price channel the pair will spend the next day, based on current volatility indicators.
CCI indicator - its entry into the oversold area (below -250) or into the overbought area (above +250) means that a trend reversal in the opposite direction is approaching.
The material has been provided by InstaForex Company - www.instaforex.comfrom RobotFX


 Download NOW!
No comments:
Post a Comment