4-hour timeframe

Technical details:
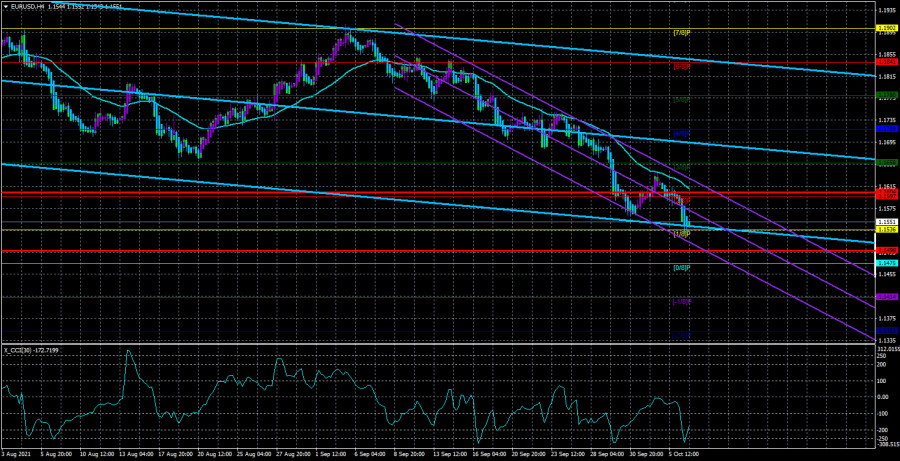
Higher linear regression channel: direction - downward.
Lower linear regression channel: direction - downward.
Moving average (20; smoothed) - downward.
The EUR/USD currency pair has started a new week in an upward movement. However, after adjusting to the moving average line, the quotes bounced off and resumed moving down. Thus, the US dollar is again rising in price against the European currency, shocking all those who are now studying fundamental factors very thoroughly. We'll talk about this a little bit below, but for now, we would like to note that everything looks almost perfect from a technical point of view. Both linear regression channels are directed downwards, the moving average is directed downwards, and the price continues to fall steadily. Also, recall that not so long ago, the pair's quotes overcame the level of 1.1700, which for a long time kept the pair from further falling. But after this happened, the price quickly reached almost the level of 1.1500. At the level of 1.1490, there is a 50.0% Fibonacci level of the entire upward trend, which began a year and a half ago. Thus, the pair is almost guaranteed to fall to the level of 1.1490. But the further fall is under a big question. At a minimum, before continuing to move south, the price should rebound from the level of 1.1490 and at least roll back up a little.
Speaking about the fact that the current strengthening of the US currency can shock everyone who thoroughly studies the fundamental factors at this time, we were not joking. Indeed, if you look at the overall fundamental picture as a whole, it becomes completely unclear, and why is the dollar growing at all now? Recall that the Fed has been beating around the bush about the decision to curtail the QE program for several months. And there are absolutely no guarantees that it will make an appropriate decision in November. A lot will depend on the Nonfarm Payrolls report, which will be released this Friday. But the ECB has already announced that it will reduce the volume of securities repurchases under the PEPP and APP programs in the third and fourth quarters. Thus, if the curtailment of QE began anywhere, it was in the European Union. Therefore, it would be logical now to see the growth of the European currency and not vice versa.
In addition, the situation in Congress is now frankly heating up in the States. No, now we are not talking about a new political crisis. We are talking about the fact that Democrats and Republicans cannot or do not want to agree to raise the debt limit or "freeze" its validity. Thus, already on October 18, the US Treasury Department may suspend some types of payments, which will mean a "technical default." Of course, a "technical default" does not mean that the States no longer have money, and the country will not be able to distribute its debts and pay all its bills. Everyone understands that a "technical default" is something like a "shutdown," of which there were only two under Donald Trump, and one of them is the longest in the entire history of the United States. Back then, Democrats and Republicans couldn't agree on a budget either. Thus, formally, in two weeks, the States may declare a "technical default," but it is unlikely that this will happen.
Recall that Democrats can perfectly make the decision they need without the help of "kicking" Republicans. 50 votes in the Senate is enough to decide on their own, and Kamala Harris, Vice President of the United States, will add the deciding vote. Thus, most likely, if the Democrats and Republicans fail to reach an agreement, the Democrats will decide on the debt limit at the last minute, as politicians like to do. Consequently, there will be no default. At most, the Treasury will delay a couple of payments for a couple of days. That's all. However, it is very surprising to observe the US dollar is growing when it should be declining. So it turns out that the country is on the verge of a new financial crisis and default, and the markets are buying up its currency? While completely ignoring the monetary policies of the ECB and the Fed? Thus, we believe that the current growth of the dollar is illogical. However, we remind you that illogical movements are often observed in the foreign exchange market, and not everything depends only on fundamental factors.

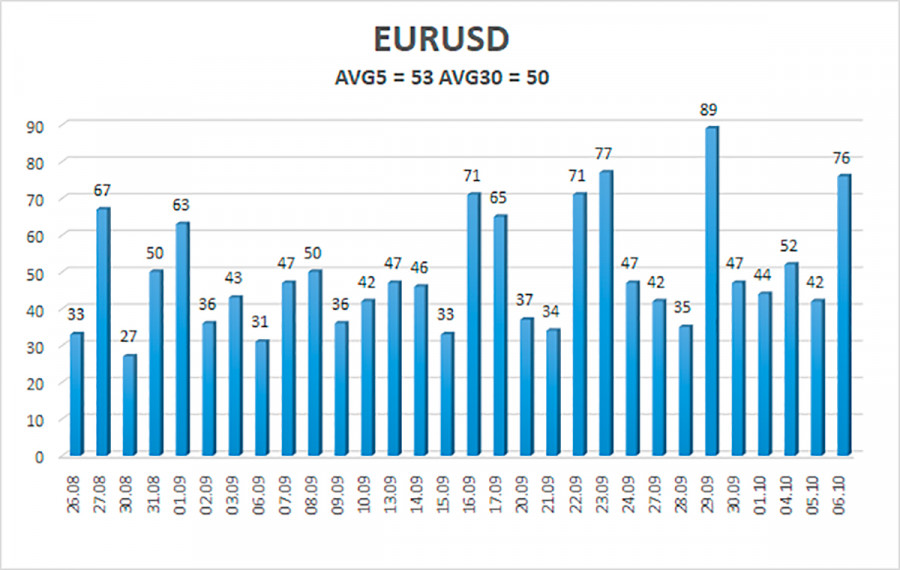
The volatility of the euro/dollar currency pair as of October 7 is 53 points and is characterized as "average." Thus, we expect the pair to move today between the levels of 1.1498 and 1.1604. A reversal of the Heiken Ashi indicator upwards will signal a new round of corrective movement.
Nearest support levels:
S1 – 1.1536
S2 – 1.1475
S3 – 1.1414
Nearest resistance levels:
R1 – 1.1597
R2 – 1.1658
R3 – 1.1719
Trading recommendations:
The EUR/USD pair resumed its downward movement. Thus, today it is necessary to stay in short positions with targets of 1.1498 and 1.1475 until the Heiken Ashi indicator turns upwards. Purchases of the pair should be opened if the price is fixed above the moving average with targets of 1.1658 and 1.1719. They should be kept open until the Heiken Ashi indicator turns down.
Explanations to the illustrations:
Linear regression channels - help to determine the current trend. If both are directed in the same direction, then the trend is strong now.
Moving average line (settings 20.0, smoothed) - determines the short-term trend and the direction in which trading should be conducted.
Murray levels - target levels for movements and corrections.
Volatility levels (red lines) - the likely price channel in which the pair will spend the next day, based on current volatility indicators.
CCI indicator - its entry into the oversold area (below -250) or into the overbought area (above +250) means that a trend reversal in the opposite direction is approaching.
The material has been provided by InstaForex Company - www.instaforex.comfrom RobotFX


 Download NOW!
No comments:
Post a Comment