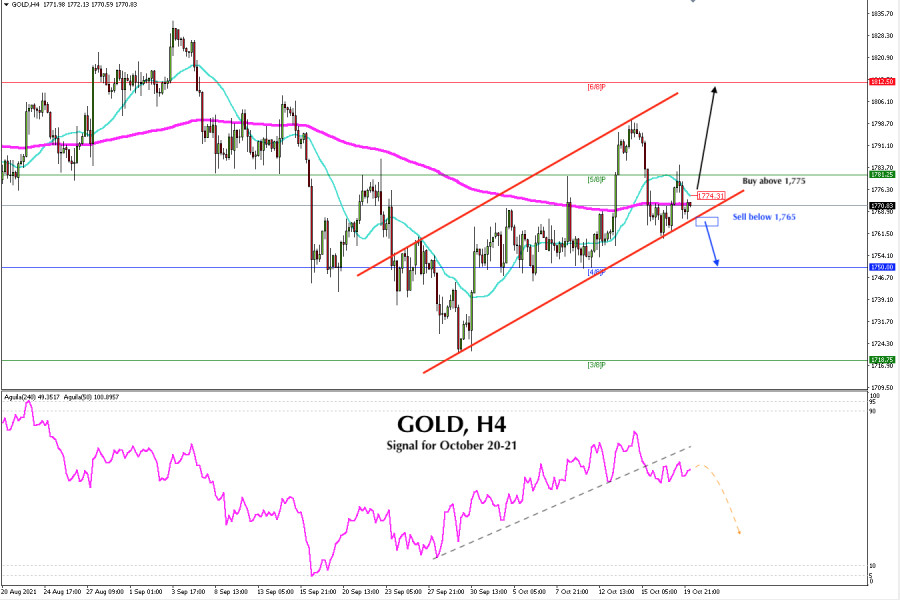
On the 4H chart, gold has been trading within an uptrend channel since September 29 when it touched the 1,721 level. Gold has recovered more than $80, registering a monthly high of 1,800.
After having touched the psychological level of 1,800, gold has made a downward correction. It is located below the SMA of 21. If the downward pressure intensifies and gold breaks the uptrend channel then it will be the beginning of a bearish scenario. It could break the 61.8% Fibonacci level located at 1,750 and fall to the support of 1,718 where3/8 of a Murray is located.
Gold may consolidate above the 21 SMA and the 200 EMA. If it rises above 1.775, it could reach the main trend target of 1,812 where it may face the strong resistance of 6/8 Murray.
According to the eagle indicator, the short-term outlook is bearish. If gold breaks below the bullish channel and fixes below 1765, it could fall to the support of 4/8 Murray at 1,750.
On the daily chart, the medium-term outlook is bearish. The 200 EMA is at 1,797, a pullback to this zone. If it fails to consolidate above, then it will be a good opportunity to sell with targets at 1,750 and 1718.
Our forecast is to sell below the 200 EMA located at 1,770. If the price consolidates above this level, gold could continue its upward movement until reaching the 1,812 level. If it declines below 1,765, it will be an opportunity to sell with targets at 1,750.
Support and Resistance Levels for October 20 - 21, 2021
Resistance (3) 1,804
Resistance (2) 1,795
Resistance (1) 1,782
----------------------------
Support (1) 1,759
Support (2) 1,750
Support (3) 1,737
***********************************************************
A trading tip for GOLD for October 20 - 21, 2021
Sell below 1,765, with take profit at 1,750 (4/8), stop loss above 1,772.
Buy above 1,775, (SMA 21), with take profit at 1,781 and 1,795 (Daily-EMA 200), stop loss below 1,768.
The material has been provided by InstaForex Company - www.instaforex.comfrom RobotFX


 Download NOW!
No comments:
Post a Comment