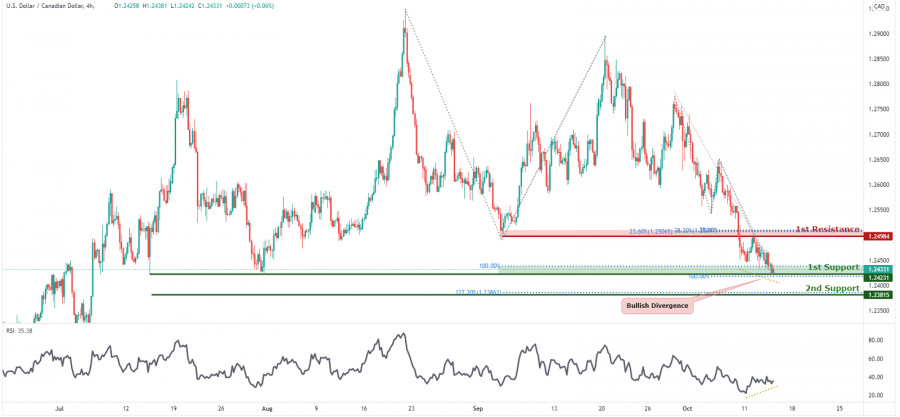
On the H4, we are expecting to see price do a bounce from 1st support at 1.24231 in line with two 100% Fibonacci projection levels taken from different points to 1st resistance at 1.24984 in line with the 38.2% and 23.6% Fibonacci retracement and a 78.6% Fibonacci projection. Our current bullish bias is supported by the existing bullish divergence where the RSI indicator is showing an uptrend, making higher lows and where price is doing a downtrend, making lower lows. Alternatively, if price breaks structure at 1st support, we may see price head for 2nd support at 1.23815 in line with the 127.2% Fibonacci extension.
Trading Recommendation
Entry:1.24231
Reason for Entry:
Horizontal swing low support and 100% Fibonacci projection
Take Profit: 1.24984
Reason for Take Profit:
Horizontal overlap resistance, 38.2% and 23.6% Fibonacci retracement and a 78.6% fibonacci projection
Stop Loss:1.23815
Reason for Stop Loss:
127.2% Fibonacci extension.
The material has been provided by InstaForex Company - www.instaforex.comfrom RobotFX


 Download NOW!
No comments:
Post a Comment