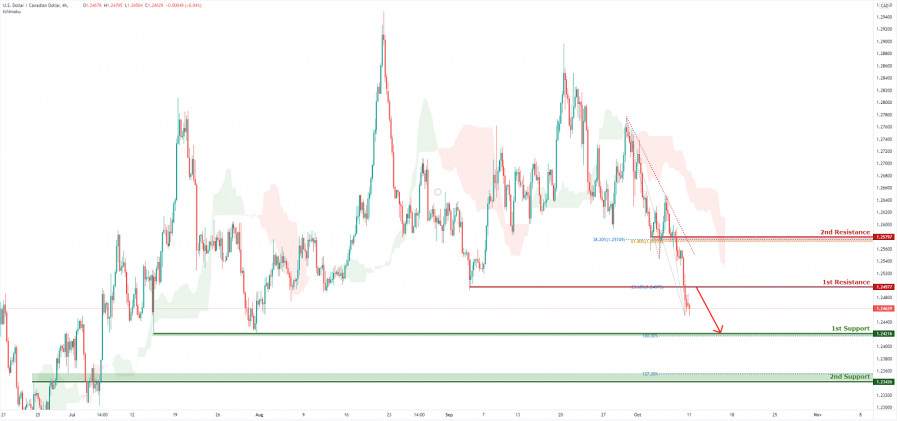
On the H4, current price is moving below the ichimoku cloud suggesting a continuation of its bearish movement. Price may possibly head back to 1st resistance at 1.24977 in line with the 23.6% Fibonacci retracement, closer to the existing descending trend line resistance area before dropping lower to 1st support at 1.24216 which is a graphical horizontal swing low support in line with the 100% Fibonacci projection. Otherwise, if price does not do the retest at 1st resistance and it is likely to just continue to drop to 1st support from current position.
Trading Recommendation
Entry:1.24977
Reason for Entry:
Horizontal overlap resistance and 23.6% Fibonacci retracement
Take Profit: 1.24216
Reason for Take Profit:
100% Fibonacci projection and Horizontal swing low support
Stop Loss:1.25797
Reason for Stop Loss:
38.2% Fibonacci retracement, 61.8% Fibonacci retracement and Graphical overlap resistance
The material has been provided by InstaForex Company - www.instaforex.comfrom RobotFX


 Download NOW!
No comments:
Post a Comment