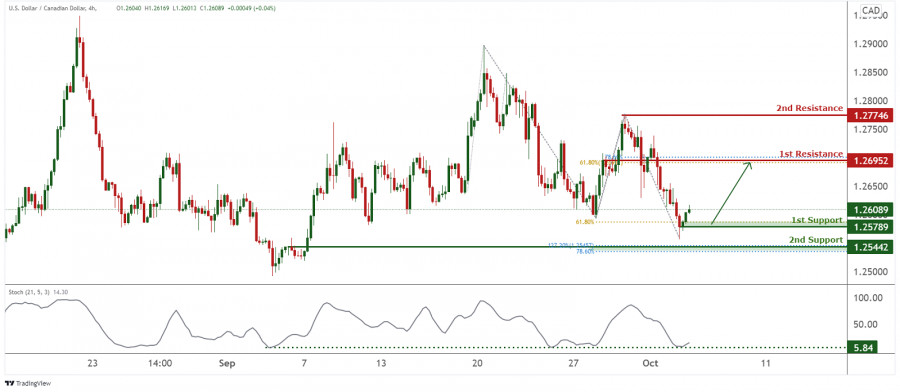
Price is holding above the 1st support at 1.25789 which is in line with the most recent horizontal swing low and 61.8% Fibonacci extension and may continue with bullish movements towards 1st resistance at 1.26952 in line with 61.8% Fibonacci Retracement, 78.6% Fibonacci extension and is a graphical resistance. Our bullish bias is further supported by the stochastic indicator where price is testing support where price bounced in the past. Otherwise, price may break structure at 1st support and head for 2nd support at 1.25442 in line with 127.2% Fibonacci retracement and 78.6% Fibonacci retracement.
Trading Recommendation
Entry:1.25781
Reason for Entry:
Horizontal Swing Low and 61.8% Fibonacci extension
Take Profit: 1.27603
Reason for Take Profit:
61.8% Fibonacci Retracement, 78.6% Fibonacci extension and graphical resistance
Stop Loss:1.25442
Reason for Stop Loss:
127.2% Fibonacci Retracement, 78.6% Fibonacci extension and graphical support
The material has been provided by InstaForex Company - www.instaforex.comfrom RobotFX


 Download NOW!
No comments:
Post a Comment