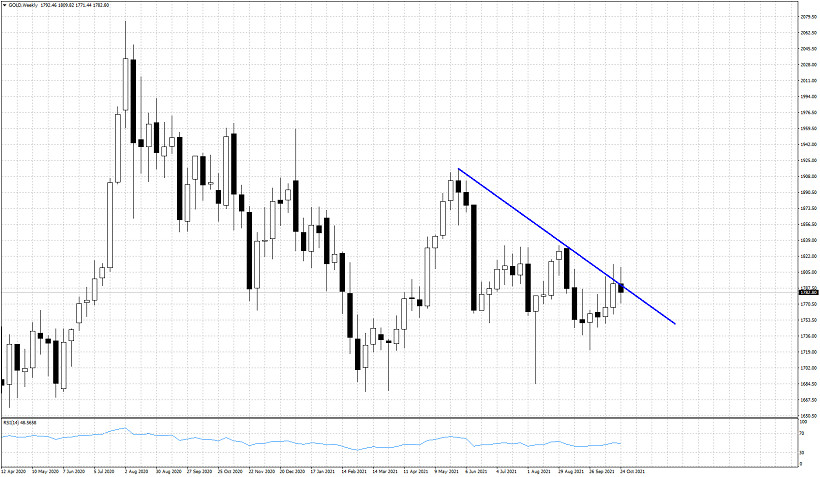
Gold price ended last week below $1,800 and specifically below $1,785. On a weekly basis price remains below the key downward sloping blue trend line resistance that we mentioned in previous posts. Last week's price action does not favor bulls. Bulls need to show signs of strength soon, otherwise we could see price fall even lower.

Gold price last week closed lower than the previous week. This was not necessarily a bearish sign, however the inability to break the blue trend line resistance was a bearish sign. Bulls need to recapture $1,792 and at least close above this level. This would bring price above the weekly trend line resistance and could provide more strength to bulls. Gold bulls need to hold above last week's lows. Breaking below them would be another bearish signal.
The material has been provided by InstaForex Company - www.instaforex.comfrom RobotFX


 Download NOW!
No comments:
Post a Comment