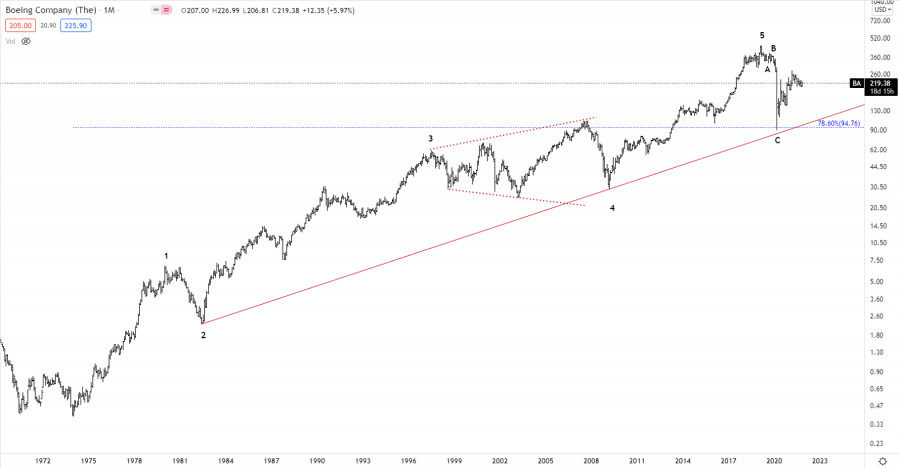
Boeing peaked in March 2019 at 446.01. A 45 year impulsive cycle completed with the rally from 0.38 to 446.01 and a corrective decline was about to unfold in the years ahead. We have seen a corrective decline from the 446.01 peak to test the 78.6% corrective target at 94.76 which is a text-book corrective decline. That said, the corrective decline from the March 2019 peak has only taken 2a years, which we consider is to short to correct the 45 year rally, which is why we expect the correction to continue, but within that correction we could easily see Boeing gain 200-300% as it already has. The difficult thing here is, that price behavior within corrections and especially B-waves can be almost impossible to read and whoever has the courage to trade the B-wave could easily find oneself in trouble.
We would expect the correction to last more that 12 years to fulfill the degree related to the 45-year impulsive rally, which means a correction to at least 2031 and maybe even longer.
The material has been provided by InstaForex Company - www.instaforex.comfrom RobotFX


 Download NOW!
No comments:
Post a Comment