To open long positions on EUR/USD, you need:
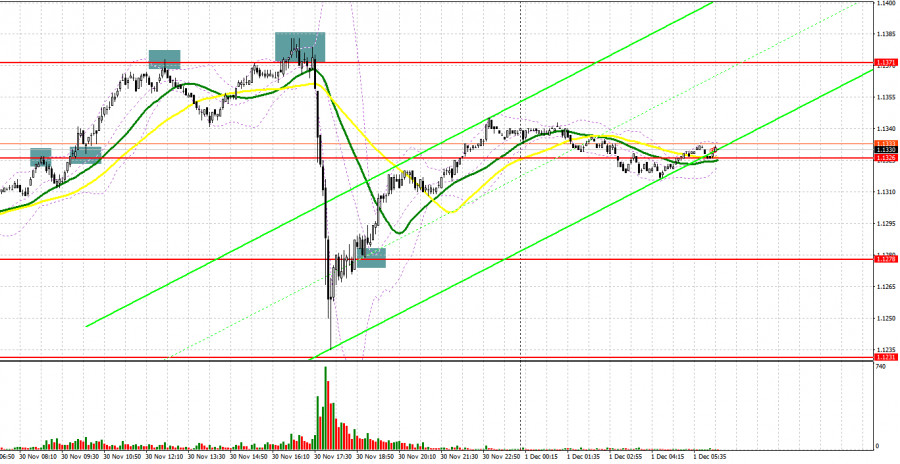
Yesterday, the European currency rose in the first half of the day after strong inflation data in the eurozone, but then collapsed after the speech of the chairman of the Federal Reserve, who announced more active curtailment of the bond purchasing program this year and next. Volatility was quite high and against this background, many signals were formed to enter the market. Let's look at the 5-minute chart and figure out the points. Even at the very beginning of the European session, the bears managed to protect the resistance of 1.1326, forming a false breakout there, which led to a signal to sell the euro. However, there was no major downward movement, and after the pair fell by 12 points, the demand for risky assets returned. A repeated test and a breakthrough of 1.1326 and then a return to this level from top to bottom led to the formation of a signal to buy the euro, which resulted in a powerful growth of almost 50 points to the next resistance of 1.1371. In the afternoon, there were several false breakouts of the 1.1371 level, which gave sell signals each time. As a result, the euro collapsed by more than 140 points, but then quickly compensated for the losses. If you look at it this way, not much has changed from the technical picture.

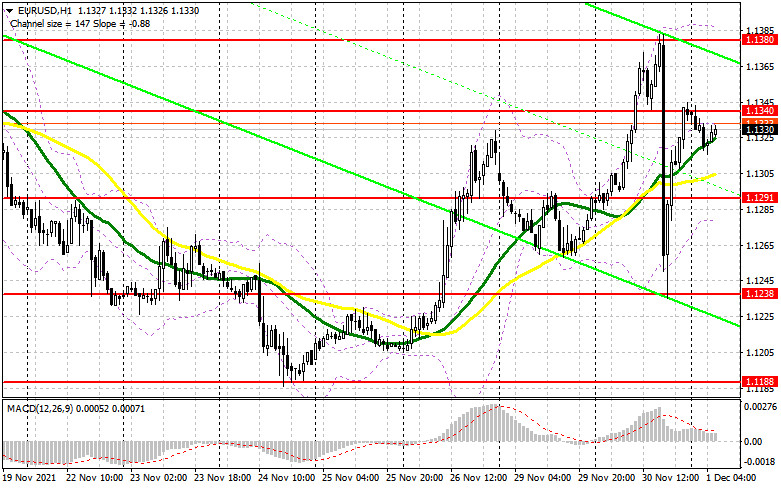
A number of data on activity in the manufacturing sector of the eurozone countries for November of this year will be released today, which may cool down the bulls in the morning. It is very important for bulls to reserve the nearest support of 1.1291, as the further upward correction of the pair depends on it. Only the formation of a false breakout there, along with good statistics on the manufacturing sector, will lead to the formation of the first entry point into the market after yesterday's collapse. The estimate will be on the pair's succeeding growth and the breakthrough of the resistance of 1.1340 formed by the results of yesterday. A breakthrough and a top-down test of 1.1340, similar to what I discussed above, will provide an excellent entry point into the market with the prospect of updating the 1.1380 high and reaching 1.1420. A more distant goal will be 1.1462, where I recommend taking profits. In case EUR/USD falls to 1.1291 and we receive weak fundamental statistics for the eurozone, it is best not to rush into long positions. I advise you to wait for the next fall and the formation of a false breakout at the 1.1238 low. You can open long positions on EUR/USD immediately for a rebound from 1.1188, or even lower - from 1.1155, counting on a correction of 15-20 points within a day.
To open short positions on EUR/USD, you need:
Bears have confidently declared themselves, but, as you can see, there are also quite a few bulls. The bears' main task for this morning is to protect the resistance of 1.1340, as the euro cant be released above it. The formation of a false breakout there, along with weak data on the eurozone manufacturing sector for November, will provide an excellent entry point into short positions in continuation of yesterday's bearish momentum formed after the speech of Federal Reserve Chairman Jerome Powell. Do not forget about the new strain of coronavirus, which will also keep the pair from a rapid recovery. Any news about its next rapid spread will return pressure on the euro. An equally important task for the bears is to regain control over the 1.1291 support, just above which the moving averages are now playing on the bulls' side. Its breakthrough and bottom-up test will lead to forming a signal to open short positions with the prospect of a decline in the area of 1.1238. A more distant goal is the support of 1.1188, where I recommend taking profits. If the euro rises and bears are inactive at 1.1340, it is better to wait for short positions. The optimal scenario will be short positions when forming a false breakout in the area of 1.1380. It is possible to open short positions immediately for a rebound from the highs: 1.1420 and 1.1462, aiming for a downward correction of 15-20 points.

I recommend for review:
The Commitment of Traders (COT) report for November 23 revealed that both short and long positions increased. However, there are still more of the former, which led to an increase in the negative delta. The data on activity in the manufacturing sector of the eurozone countries provided significant support to the euro last week, but the pressure on risky assets remained. A strong US GDP report and Federal Reserve minutes from its last meeting have boosted the dollar as many traders look forward to more aggressive monetary policy changes as early as December this year. However, all this can be prevented by the new strain of the Omicron coronavirus, the spread of which is actively observed in the eurozone and African countries. This strain has not yet been registered in the US, but it is only a matter of time. Bulls can only wait for hawkish statements from European politicians, which were actively sounded last week, which also supported the euro. The latest November COT report indicated that long non-commercial positions rose from 198,181 to 204,214, while short non-commercial positions also jumped from 202,007 to 220,666. At the end of the week, the total non-commercial net position increased to -16,452 against -3,826. The weekly closing price dropped to 1.1241 against 1.1367.
Indicator signals:
Trading is carried out just above the 30 and 50 daily moving averages, which indicates an attempt by the bulls to continue the upward correction.
Moving averages
Note: The period and prices of moving averages are considered by the author on the H1 hourly chart and differs from the general definition of the classic daily moving averages on the daily D1 chart.
Bollinger Bands
In case of growth, the upper border of the indicator at 1.1380 will act as resistance. In case of a decline, the lower border of the indicator in the area of 1.1280 will act as a support.
Description of indicators
- Moving average (moving average, determines the current trend by smoothing out volatility and noise). Period 50. It is marked in yellow on the chart.
- Moving average (moving average, determines the current trend by smoothing out volatility and noise). Period 30. It is marked in green on the chart.
- MACD indicator (Moving Average Convergence/Divergence — convergence/divergence of moving averages) Quick EMA period 12. Slow EMA period to 26. SMA period 9
- Bollinger Bands (Bollinger Bands). Period 20
- Non-commercial speculative traders, such as individual traders, hedge funds, and large institutions that use the futures market for speculative purposes and meet certain requirements.
- Long non-commercial positions represent the total long open position of non-commercial traders.
- Short non-commercial positions represent the total short open position of non-commercial traders.
- Total non-commercial net position is the difference between short and long positions of non-commercial traders.
from RobotFX


 Download NOW!
No comments:
Post a Comment