EUR/USD 24-hour TF analysis.

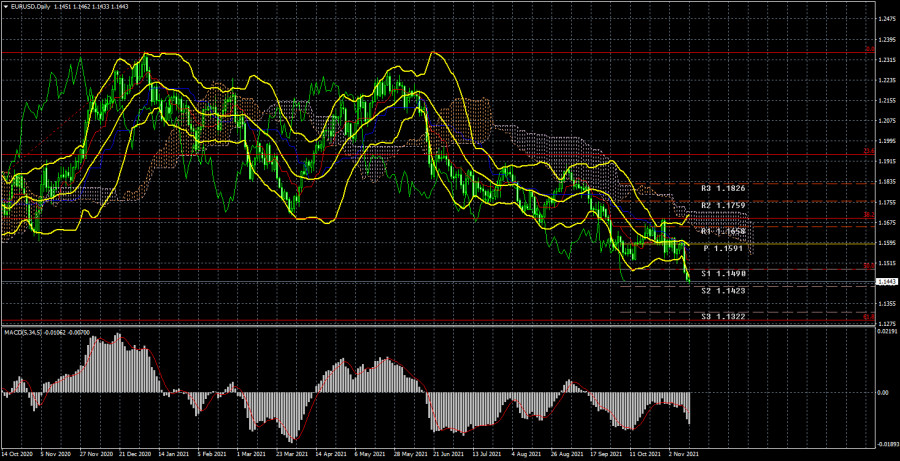
The EUR/USD currency pair has collapsed by 125 points during the current week, which is quite a lot for it. Thus, in the last few months, the strengthening of the US currency has increased quite unexpectedly, and the pair managed to overcome the important Fibonacci level of 50.0% (1.1490) this week. Thus, now the fall of the euro/dollar pair quotes can continue with the targets of 1.1423, 1.1322, and 1.1289. We still consider the current movement to the south as a correction against the global upward trend. However, this correction is very much delayed, as it has been lasting for 10.5 months. The fact remains that the markets have not yet found a reason to buy the euro or sell the US dollar. Thus, the downward trend is now clearly visible on the 24-hour timeframe. The volatility of the pair remains low in most cases, but we have already talked about this hundreds of times. Nothing can be done about it and, from this point of view, a 24-hour TF is now even more appropriate to consider in trading than a 4-hour one. It should also be noted that the growth of dollar quotes this week happened only because of one event. Inflation in the US rose to 6.2% y/y, which exceeded the wildest expectations of the markets. Thus, the US dollar showed strong growth, but this is in some way a paradox. Since, in theory, high inflation is bad for the economy and the national currency. Nevertheless, the markets still regard these macroeconomic statistics differently. In any case, we remind you that any fundamental theory must be confirmed by specific technical signals. Since there are no buy signals now and there are no signals about the end of the downward trend, it is still not recommended to consider purchases.
Analysis of the COT report.

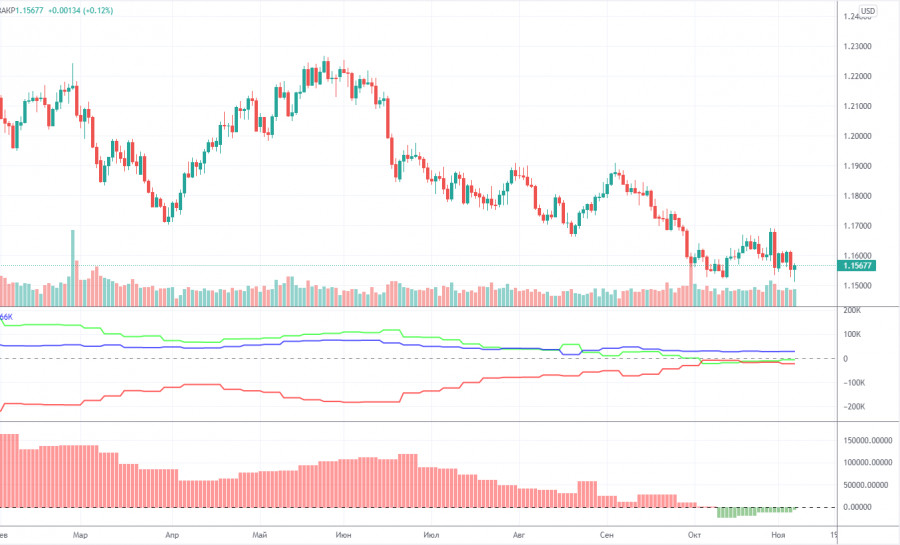
During the last reporting week (November 8-12), the mood of non-commercial traders changed, but not much. A group of traders "Non-commercial" closed 4 thousand contracts for purchase and 10,500 contracts for sale. Consequently, the net position of professional players has grown by 6,500, which is not so much. However, the changes in the mood of non-commercial traders are best seen by the first indicator in the illustration above. The red and green lines have been moving towards each other for a long time, and in the last couple of months, they have been almost at the same level. This indicates that the previous trend is ending, and the mood of the major players at this time is as neutral as possible. This is confirmed by the data on the total number of contracts. The "Non-commercial" group has 195 thousand buy contracts, and 199 thousand sell contracts. The Commercial group has 418 thousand contracts for purchase and 442 thousand contracts for sale. As we can see, the numbers are almost the same. Therefore, there are theoretical chances for the continuation of the downward movement in the pair. The trend began to end (an uptrend) when the red and green lines (net positions of the "Commercial" and "Non-commercial" groups) began to narrow. That is, for quite a long time. And now, logically, the downward trend continues. However, this "trend" is still not too similar to the trend. Rather, a banal three-wave correction. The new COT report was not released on Friday, although it should have been. Thus, it should be expected in the next working days.
Analysis of fundamental events.
The current week has been as boring as possible in terms of macroeconomic and fundamental events. As mentioned above, there was only one important report on Wednesday - American inflation. This provoked the strong strengthening of the US dollar, which continued on Thursday and Friday. Moreover, on Friday, the dollar had very few reasons to continue growing, as the consumer sentiment index from the University of Michigan dropped from 71.7 points to 66.8. Usually, this indicator does not provoke serious movements. However, if its value changes unexpectedly for the markets and very much does not correspond to the forecast, it can provoke a reaction. And on Friday, there was just such a case. However, traders very quickly digested the weak report for the dollar, and at the end of the day, the US currency still strengthened slightly. Several speeches by Christine Lagarde and Jerome Powell this week did not give any new information to traders.
Trading plan for the week of November 15-19:
1) In the 24-hour timeframe, the upward trend has not changed. At the moment, the quotes remain below the Kijun-sen line, and the markets have shown that they are not ready to buy the pair. Thus, the downward movement may continue with targets of 1.1322 and 1.1289. Whatever the fundamental and macroeconomic background, the markets are now favorably looking towards the US currency. Therefore, the pair's sales remain more preferable.
2) As for purchases of the euro/dollar pair, in the current conditions, they should be considered no earlier than fixing the price above the critical line. And ideally - above the Ichimoku cloud, because the price has already overcome the Kijun-sen several times, but then could not continue moving up. There are few prerequisites for a new upward trend to begin in the near future, macroeconomics supports the dollar, and the general fundamental background still indicates a very likely fall in the exchange rate of the US currency.
Explanations to the illustrations:
Price levels of support and resistance (resistance /support), Fibonacci levels - target levels when opening purchases or sales. Take Profit levels can be placed near them.
Ichimoku indicators(standard settings), Bollinger Bands(standard settings), MACD(5, 34, 5).
Indicator 1 on the COT charts - the net position size of each category of traders.
Indicator 2 on the COT charts - the net position size for the "Non-commercial" group.
The material has been provided by InstaForex Company - www.instaforex.comfrom RobotFX


 Download NOW!
No comments:
Post a Comment