
Trend analysis (pic. 1).
On Friday, the euro/dollar pair may jump from the level of 1.1207 (the closing of yesterday's daily candlestick), trying to reach the retracement level of 14.6%, 1.1260 (blue dotted line). After testing this level, it is likely to continue its upward movement to the target level of 1.1305, the retracement level of 23.6% (blue dotted line).
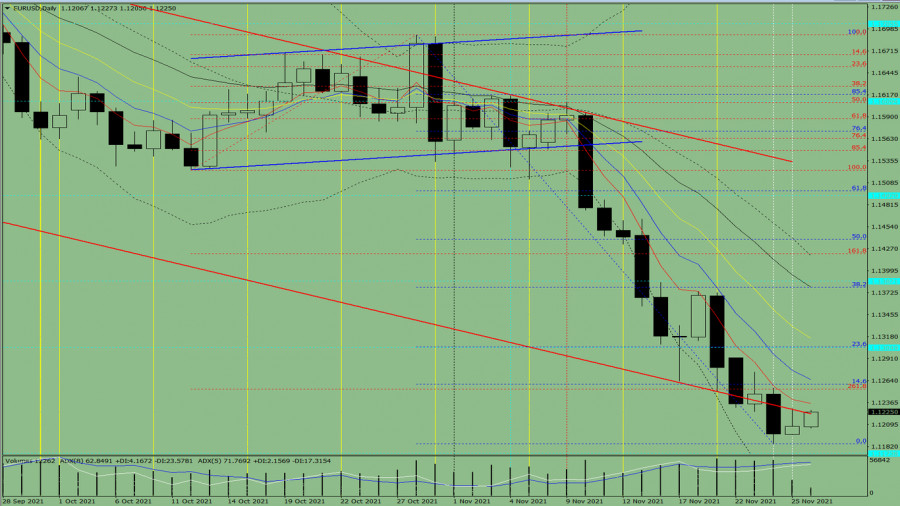
Pic. 1 (daily chart).
Complex analysis:
- technical indicators – up;
Fibonacci retracement levels - up;
- volumes - up;
- candlestick analysis - up;
- trend analysis - up;
- Bollinger lines - up;
- weekly chart-up.
Conclusion:
On Friday, the euro/dollar pair may jump from the level of 1.1207 (the closing of yesterday's daily candlestick), trying to reach the retracement level of 14.6%, 1.1260 (blue dotted line). After testing this level, it is likely to continue its upward movement to the target level of 1.1305 – the retracement level of 23.6% (blue dotted line).
An unlikely scenario is that the price may start moving up in order to reach the resistance level of 1.1223 (the red bold line) from the level of 1.1207 (the closing of yesterday's daily candlestick). After testing this level, it may decline to the target level of 1.1174, the historical support level (blue dotted line).
The material has been provided by InstaForex Company - www.instaforex.comfrom RobotFX


 Crude Oil Market Overview As of April 17, 2026, WTI crude oil is trading near $87.40. The asset maintains a bearish bias, currently position...
 Fresh from RobotFX: in-depth analysis to support your trading decisions. The wave pattern on the 4-hour chart has changed. There is sti...
 Professional traders know the value of timely analysis. Enjoy this expert forex review. On Thursday, the USD/JPY pair was struggling to...
 Technical Overview The EUR/USD 4-hour chart reflects an ambiguous wave structure. While the long-term upward trend originating in January re...
 Fresh from RobotFX: in-depth analysis to support your trading decisions. The EUR/USD pair continues its upward movement on expectations of a...


 Download NOW!
No comments:
Post a Comment