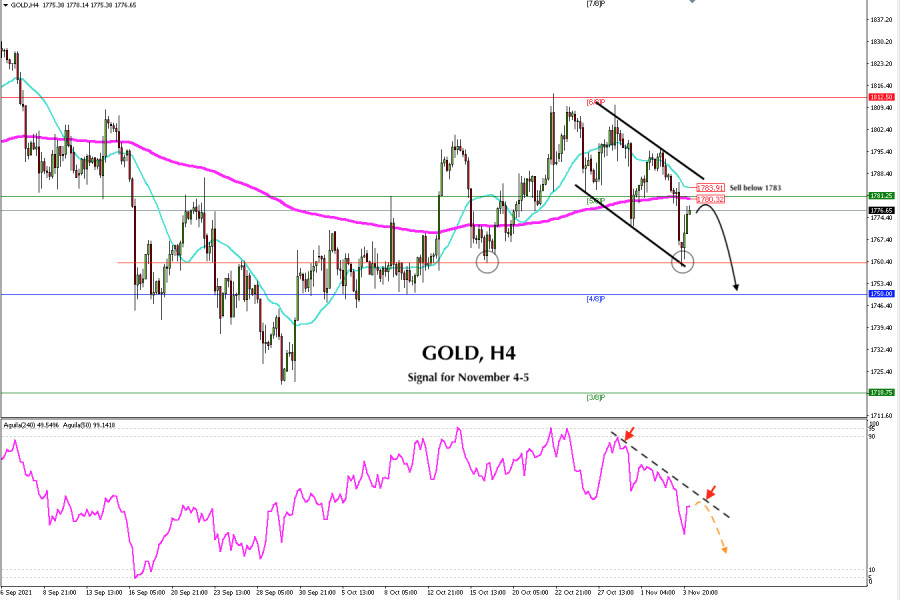
On November 3 in the American session, gold fell to the level of 1,758.90 due to the general uncertainty about monetary policy of the Federal Reserve. Having broken the EMA of 200 around 1,780, gold began a decline and reached the key support of October 18.
After the Fed announced to reduce its bond purchase program by $ 15 billion per month, gold began a strong technical rebound. At this time of writing, the metal is trading at 1,776, having regained $ 20 which represents about 2,000 pips of the price action. Now gold is approaching the strong resistance of the 200 EMA around 1,780.
Yesterday, the US central bank kept interest rates unchanged as expected and announced the reduction of its asset purchases by $ 15 billion per month. This data had already been priced in by the market. So, since last week we have seen how investors took refuge in the US dollar. In turn, gold lost its safe-haven appeal, falling from the level of 1,793.
According to the 4-hour chart, if gold consolidates below the SMA of 21 and the EMA of 200, it will be a bearish signal. Therefore, if in the next few hours the gold comes to test this resistance zone and fails to break it, it will be an opportunity to sell with targets at 1,770 and until 1,758. If the downward pressure prevails, the metal could fall to the 4/8 murray support around 1,750.
A breakout and consolidation above the downtrend channel formed on the 4-hour chart could be the start of a bullish scenario. Hence, gold could rise again to 1,812. I it breaks this barrier, it could reach the strong resistance of 7/8 of murray around 1,843.
Since October 27, the eagle indicator reached the 90-point level and began a fall in volume, oscillating below a downtrend channel. This suggests that gold could continue with its decline in the next days.
In the chart above, we can see that the range level between 1,750-1,760 is strong support. Since September 16, gold has rebounded many times. If the price falls again, this level will be a good opportunity to buy.
Support and Resistance Levels for November 04 - 05, 2021
Resistance (3) 1,801
Resistance (2) 1,788
Resistance (1) 1,780
----------------------------
Support (1) 1,772
Support (2) 1,766
Support (3) 1,756
***********************************************************
A trading tip for GOLD for November 04 - 05, 2021
Sell below 1,783 (SMA 21) with take profit at 1,772 and 1,760 (strong support), stop loss above 1,790.
The material has been provided by InstaForex Company - www.instaforex.comfrom RobotFX


 Download NOW!
No comments:
Post a Comment