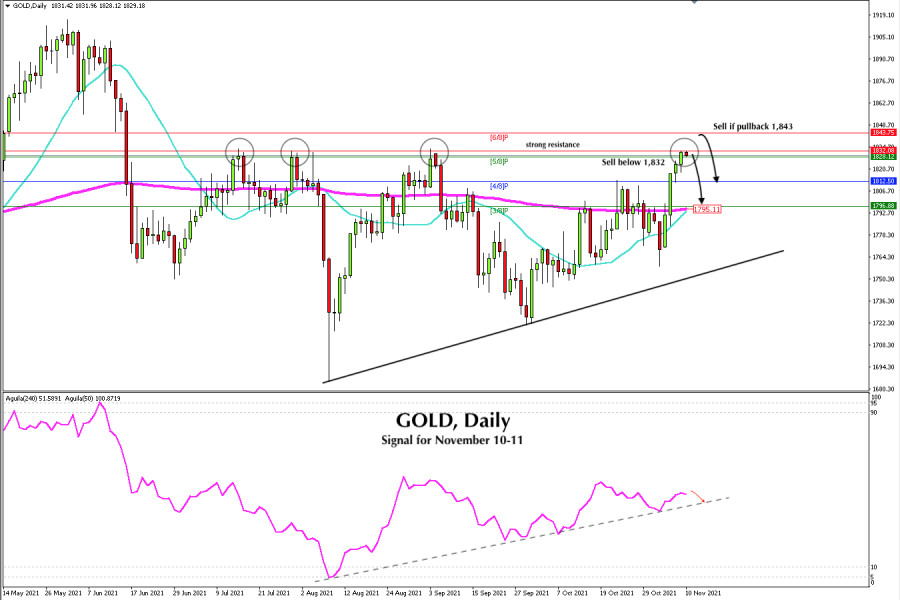
Gold is trading at 1,828. It seems strong enough to break the resistance at 1,834. As you can see in the chart, there are 4 circles that show the opportunities that gold tried to break this barrier.
Early in the American session, the US CPI will be published. An annual increase of 5.8% is expected versus the 5.4% growth in September. If the actual data is higher than expected, it could favor the US dollar and it could exert downward pressure on gold, so the metal could fall to the support 4/8 murray around 1,812.
According to the daily chart, we can see that since July, gold has been trying to break the strong resistance of 1,832. It could not jump above this level, so it fell several times. We believe this will happen again in the coming days.
On the other hand, if gold surpasses the zone of 1,835, it could rise rapidly to the resistance of 6/8 of murray in 1843.
Our trading plan is to sell below 1,832 with targets at 1,812. A sharp break of 4/8 of murray could fall to the support of 1,796 where the EMA of 200 is located.

The eagle indicator is oscillating above an uptrend channel. A correction is expected in the next few hours, since the indicator is showing a slight bearish signal.
A pullback to strong resistance at 1,843 will be a good opportunity to sell with targets at 1,832 and 1,812.
Below we leave the support and resistance levels for the next two days.
Support and Resistance Levels for November 10 - 11, 2021
Resistance (3) 1,850
Resistance (2) 1,843
Resistance (1) 1,836
----------------------------
Support (1) 1,822
Support (2) 1,812
Support (3) 1,796
***********************************************************
A trading tip for GOLD for November 10 - 11, 2021
Sell below 1,832 (strong resistance) with take profit at 1,812 and 1,795 (EMA 200), stop loss above 1,837.
The material has been provided by InstaForex Company - www.instaforex.comfrom RobotFX


 Download NOW!
No comments:
Post a Comment