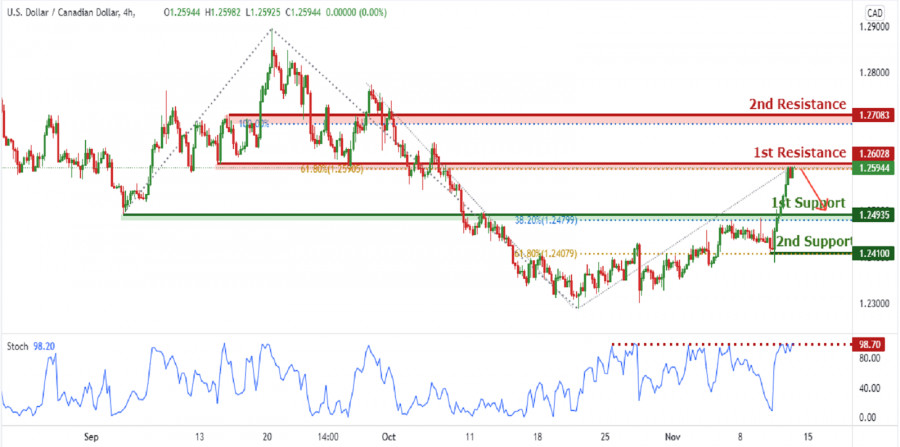
On the H4, with price approaching resistance on the stochastics indicator and the graphical resistance at 1.26028 in line with the 61.8% Fibonacci retracement at 1st resistance, we have a bearish bias that price will to 1st support at 1.24935 in line with the graphical swing overlap support and 38.2% Fibonacci retracement and possibly to 2nd support at 1.24100 in line with the horizontal swing low support and 61.8% Fibonacci retracement. Alternatively, we may see price break 1st resistance structure and head for 2nd resistance at 1.257083 in line with the 100% Fibonacci projection level and horizontal overlap resistance.
Trading Recommendation
Entry: 1.26028
Reason for Entry:
61.8% Fibonacci retracement and the horizontal swing high resistance
Take Profit: 1.24935
Reason for Take Profit:
Graphical swing overlap support and 38.2% Fibonacci retracement
Stop Loss:1.257083
Reason for Stop Loss:
100% Fibonacci projection level and horizontal overlap resistance
The material has been provided by InstaForex Company - www.instaforex.comfrom RobotFX


 Download NOW!
No comments:
Post a Comment