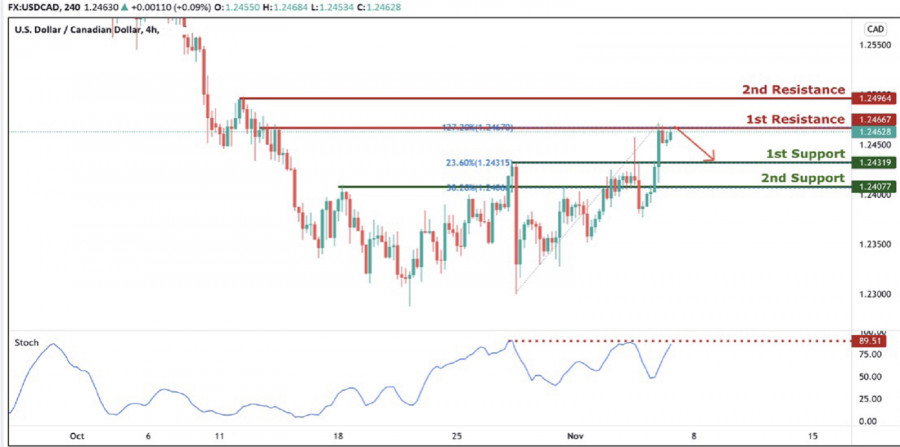
On the H4, with price approaching both our graphical swing high resistance and the resistance on the stochastics indicator, we are expecting to see price dip from 1st resistance at 1.24667 in line with the 127.2% Fibonacci extension to 1st support at 1.24319 in line with the 23.6% Fibonacci retracement levels and graphical overlap resistance and possibly to our 2nd support at 1.24077 in line with the 38.6 Fibonacci retracement and graphical overlap support. Alternatively, we may see price break structure at 1st resistance and head for 2nd resistance at 1.24964 in line with our graphical swing high resistance.
Trading Recommendation
Entry: 1.24667
Reason for Entry:
127.2% Fibonacci extension and graphical swing high resistance
Take Profit:1.24319
Reason for Take Profit:
23.6% Fibonacci retracement levels and graphical overlap resistance
Stop Loss:1.24964
Reason for Stop Loss:
graphical swing high resistance
The material has been provided by InstaForex Company - www.instaforex.comfrom RobotFX


 Download NOW!
No comments:
Post a Comment