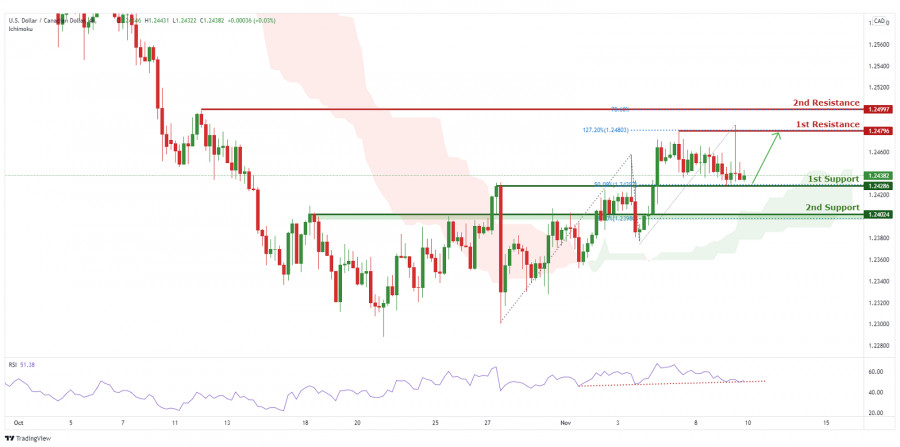
On the H4, with price bouncing off the support on the RSI indicator and price moving above the ichimoku cloud, we have a bullish bias that price will rise from 1st support at 1.24286 in line with the 50% Fibonacci retracement levels and the horizontal overlap support to 1st resistance at 1.24796 in line with the graphical swing high resistance and possibly even to 2nd resistance at 1.24964 in line with the graphical swing high from 12th of October. Alternatively, we may see price break 1st support structure and head for 2nd support at 1.24024 in line with the 78.6% Fibonacci retracement level and horizontal overlap support.
Trading Recommendation
Entry: 1.24286
Reason for Entry:
50% Fibonacci retracement levels and the horizontal overlap support
Take Profit:1.24796
Reason for Take Profit:
graphical swing high resistance
Stop Loss:1.24024
Reason for Stop Loss:
78.6% Fibonacci retracement level and horizontal overlap support
The material has been provided by InstaForex Company - www.instaforex.comfrom RobotFX


 Download NOW!
No comments:
Post a Comment