Analysts hope the uptrend continues, but Bitcoin is falling again
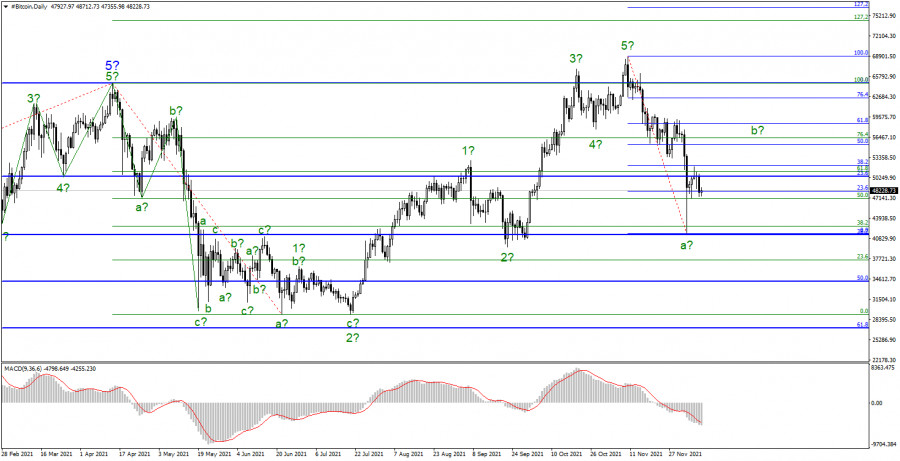
On December 9, BTC fell by $1,500. The coin is likely to extend its downward movement that began on November 10. Last Saturday, the flagship cryptocurrency tumbled by $15,000 and then recouped half of its losses. For the next several days, the digital asset showed growth. On Thursday, however, the quote started to go down again. Many crypto analysts say long-term and large investors bought out all falls and corrections, which helped maintain the uptrend. I'd like to point out that the majority of forecasts for Bitcoin are usually bullish. For example, analyst PlanB with his Stock-to-Flow model has confirmed that things do not always go according to the plan, and Bitcoin can not only grow, but also decline. I will conduct wave analysis a bit later. But it is clearly seen that the last wave is stronger and deeper even without the analysis. The current size of the wave is $27,000, which is about one-third of the coin's highest level, and I am not sure its formation has been completed. So, it seems that a new downtrend section is about to begin.
Louis Navellier assumes BTC could plunge by 80%
Many analysts and investors believe that Bitcoin will eventually hit the $100,000 mark. The digital asset was expected to touch it by the end of 2021. Now everyone hopes it will happen in March 2022. However, Louis Navellier, chairman of Navellier & Associates, has a completely different view. Navellier is concerned about the hype around the world's first cryptocurrency. The investor suggests the BTC bubble could burst any time soon as the US Federal Reserve has started the winddown of the QE program and may well end it several months earlier than expected. "The more the Fed tapers, the more volatility we should see in both stocks and bonds — and yes, Bitcoin, too," he explained. "I would say that a drop below $46,000 (200-day moving average) would be a bearish signal. To complete the "double top" pattern, Bitcoin must fall to $28,500, and such a decline may indicate a fall below $10,000. This is a decline of 80% and Bitcoin has repeatedly demonstrated this behavior," the investor said.

The current uptrend structure still looks clear. The wave layout cleared up after the instrument went above the high of Wave 3. On the chart, there is now an impulsive 5-wave structure that began to form on July 20. However, over the past three weeks, the price has been pulling back from the highs, indicating the completion of Wave 5. This wave looks shorter. After plummeting by $27,000, the quote went up and the corrective wave (b) was formed. Therefore, the price is likely to rise within this wave with targets at around $52,077 and $55,295, in line with the 38.2% and 50.0% Fibonacci levels of wave (a). After the completion of this wave, a new descending wave (c) may start to form, with its low being well below the level of $41,700. If the quote touches this mark, the uptrend is likely to reverse, marking the beginning of a downtrend.
The material has been provided by InstaForex Company - www.instaforex.comfrom RobotFX


 Download NOW!
No comments:
Post a Comment